Introduction
In the current era of data-centric operations, ensuring peak database performance and robust security is essential for delivering uninterrupted user experiences and avoiding expensive system failures. The exponential growth of applications and their associated data volumes presents significant challenges for developers and database administrators in efficiently managing database operations. Rapydo’s automation capabilities provide a powerful solution to these challenges through intelligent, user-defined rules that proactively monitor and manage your database infrastructure. These flexible rules enable comprehensive management across various aspects of database operations, including performance optimization, security reinforcement, and resource management. By triggering precise actions in response to specific conditions, automation rules help you maintain Service Level Agreement (SLA) commitments, strengthen security protocols, and streamline overall database administration—all without manual intervention.How Automation Works in Rapydo
- Prevent Issues Before They Escalate: Automatically respond to performance degradation
- Maintain Consistent Performance: Enforce query duration limits and resource constraints
- Stay Informed: Receive alerts via email or webhook when thresholds are breached
- Reduce Manual Overhead: Let automation handle routine monitoring and responses
Automation Modules
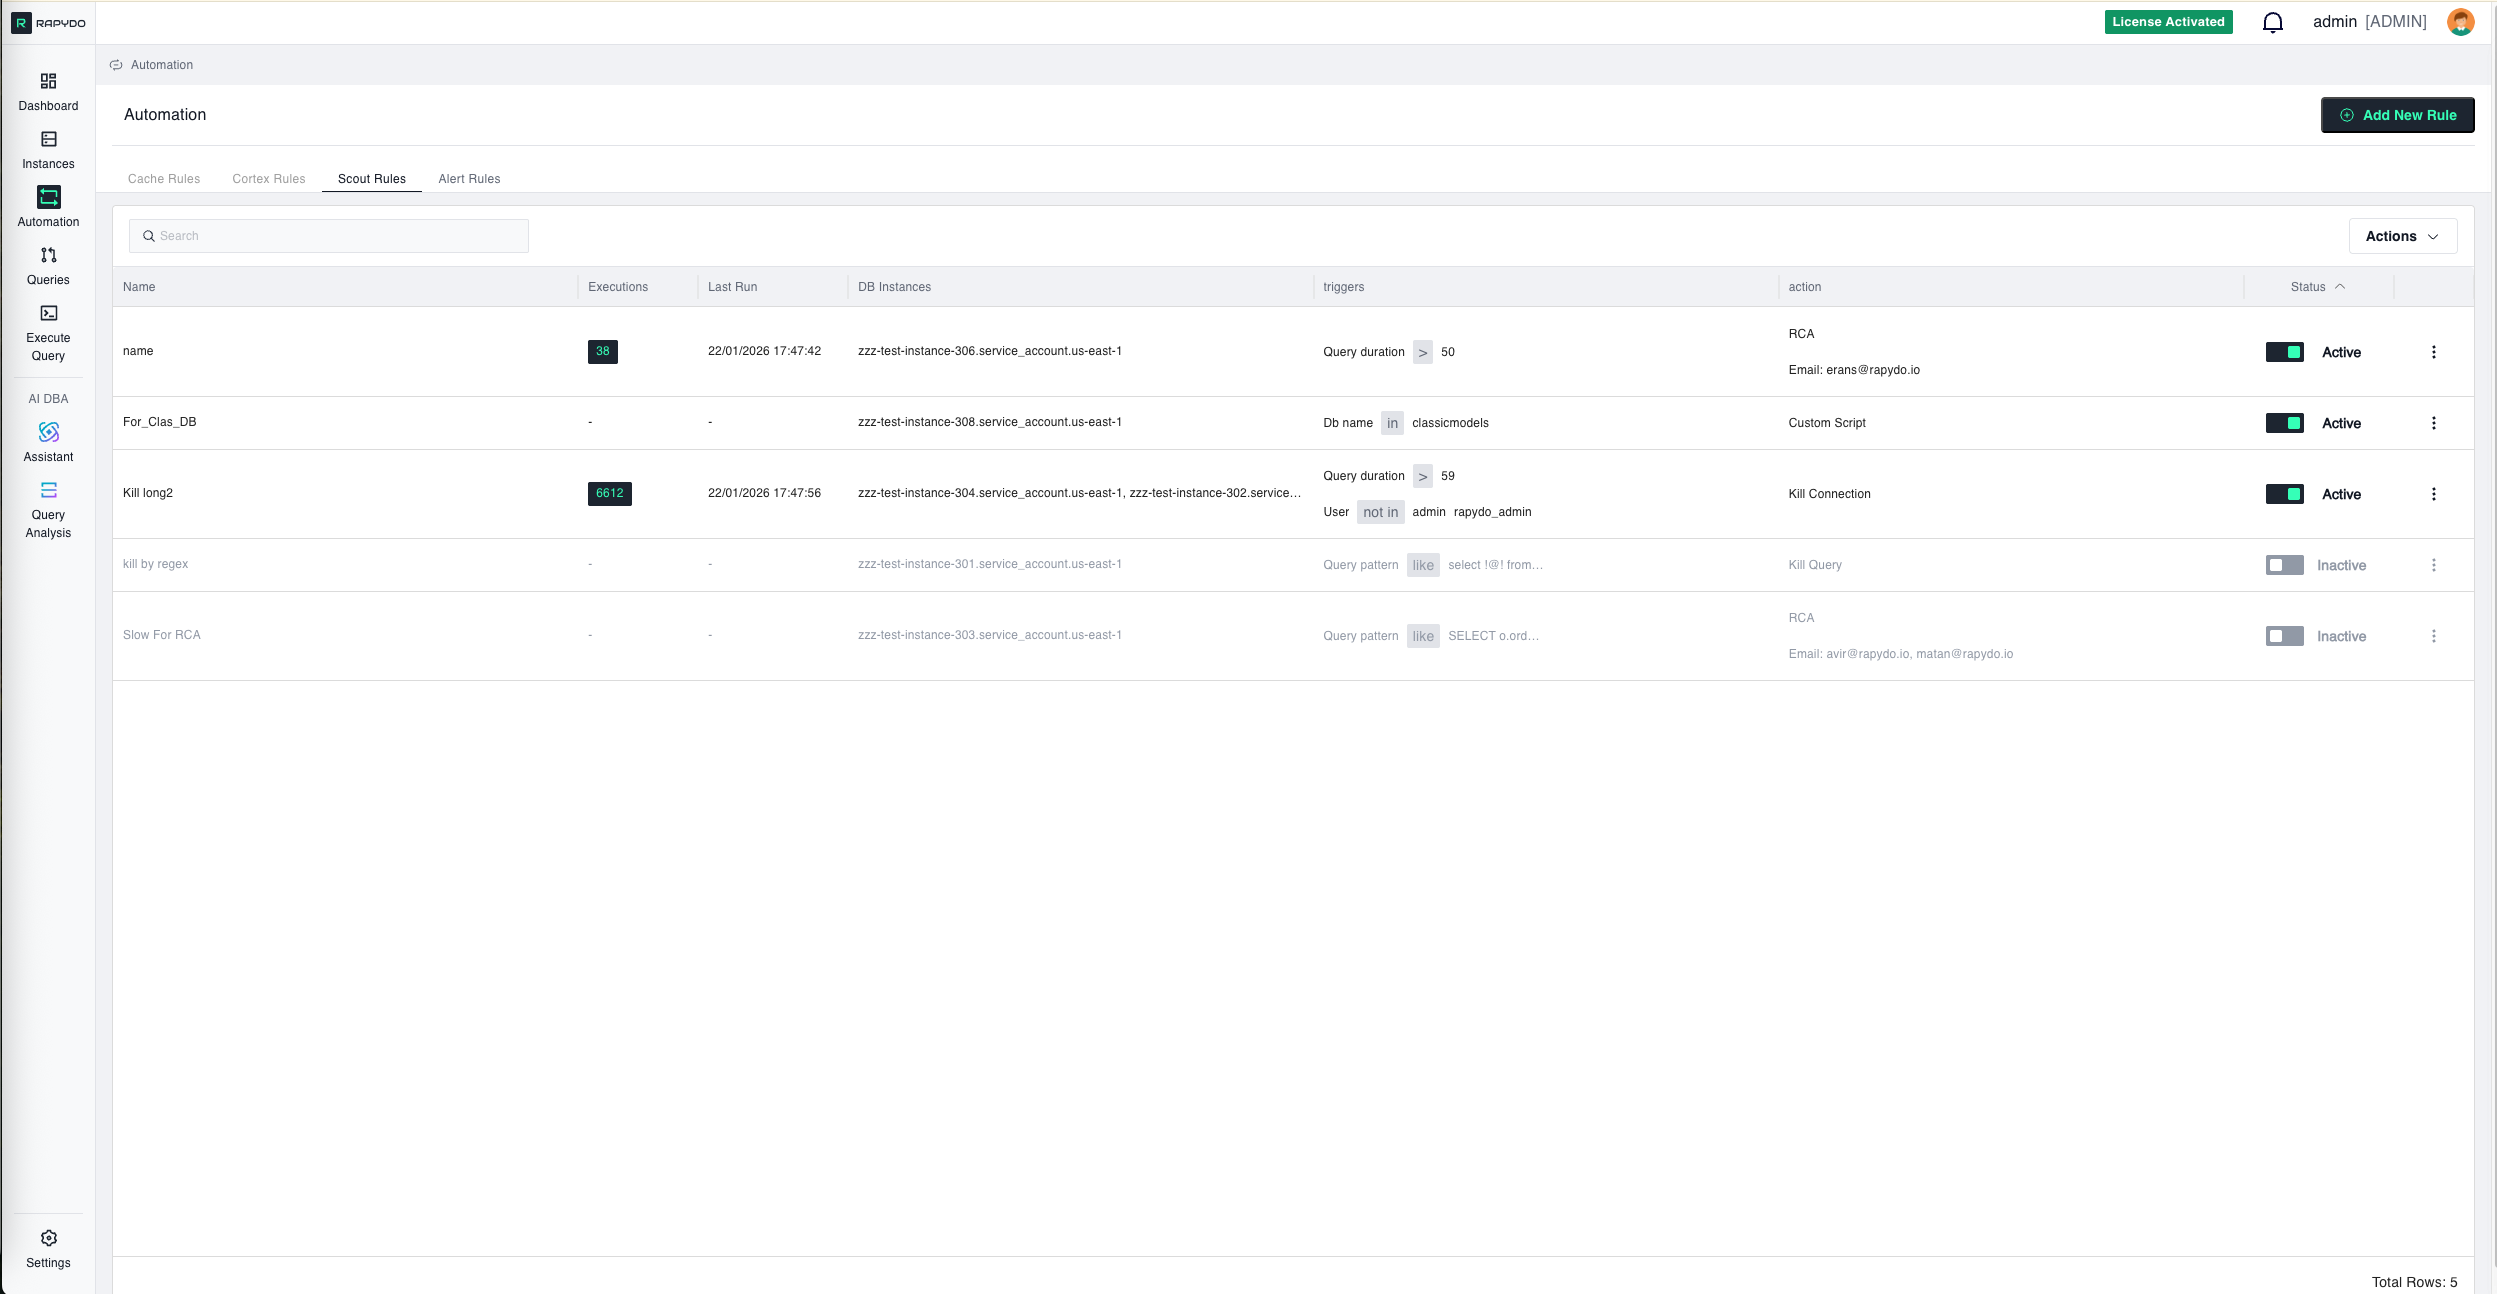
Rapydo provides two types of automation rules, each designed for specific monitoring and management scenarios:Scout Rules
Scout Rules monitor long-running queries and database activity in real-time. These rules are ideal for:- Query Duration Monitoring: Detect and respond to queries that exceed time thresholds
- Automatic Query Termination: Kill queries that run too long and consume excessive resources
- Performance Protection: Prevent runaway queries from impacting overall database performance
- Custom Alerting: Get notified when specific query patterns or durations are detected
- Kill any query running longer than 5 minutes
- Alert when specific users run queries exceeding duration limits
- Automatically terminate queries from specific databases that exceed thresholds
- Monitor and respond to queries matching specific patterns (e.g., full table scans)
Alert Rules
Alert Rules monitor database and system metrics, notifying you when performance thresholds are exceeded. These rules are ideal for:- Resource Monitoring: Track CPU, memory, connections, and IOPS usage
- Threshold-Based Alerting: Get notified when metrics exceed defined limits
- Multi-Channel Notifications: Receive alerts via email or webhook
- Proactive Issue Detection: Identify resource constraints before they cause outages
- Alert when CPU usage exceeds 80% for more than 5 minutes
- Notify team via webhook when connection pool reaches 90% capacity
- Send email alerts when IOPS usage spikes unexpectedly
- Monitor memory usage and alert before out-of-memory errors occur
Rule Components
Every automation rule in Rapydo consists of three key components:1. Triggers (Conditions)
The conditions that must be met for the rule to activate. Examples:- Query duration exceeds 300 seconds
- CPU usage is above 85%
- Number of connections exceeds 100
- Specific query pattern is detected
2. Filters (Optional)
Additional criteria to narrow down when the rule applies. Examples:- Only for specific databases
- Only for specific users
- Only for specific instance types
- Only during certain time periods
3. Actions
What happens when the trigger conditions are met. Examples:- Kill the query
- Send email notification
- Send webhook notification
- Log the event
Benefits of Automation
Proactive Management
Move from reactive firefighting to proactive prevention. Address issues automatically before they impact users.24/7 Monitoring
Your rules work around the clock, monitoring and responding even when your team is offline.Consistent Enforcement
Apply the same standards and responses across all database instances without manual intervention.Reduced Downtime
Automatically terminate problematic queries and alert teams to resource constraints before they cause outages.Improved SLA Compliance
Maintain performance commitments by enforcing query limits and responding to threshold breaches instantly.Team Efficiency
Free your team from routine monitoring tasks and let them focus on strategic improvements.Getting Started with Automation
Ready to set up your first automation rule? Here’s the typical workflow: Step 1: Choose Your Rule Type- Scout Rules for query monitoring and termination
- Alert Rules for metric-based notifications
- Set thresholds (duration, CPU %, connections, etc.)
- Add filters (database, user, query pattern)
- Specify evaluation frequency
- Choose what happens when conditions are met
- Set up notification channels (email, webhook)
- Test the rule with sample scenarios
- Review rule execution logs
- Adjust thresholds based on real-world behavior
- Add or modify rules as your needs evolve
What’s Next?
- Defining Rules - Learn the step-by-step process for creating automation rules
- Scout Rules Reference - Complete guide to Scout Rules triggers and actions
- Alert Rules Reference - Complete guide to Alert Rules triggers and actions