Overview
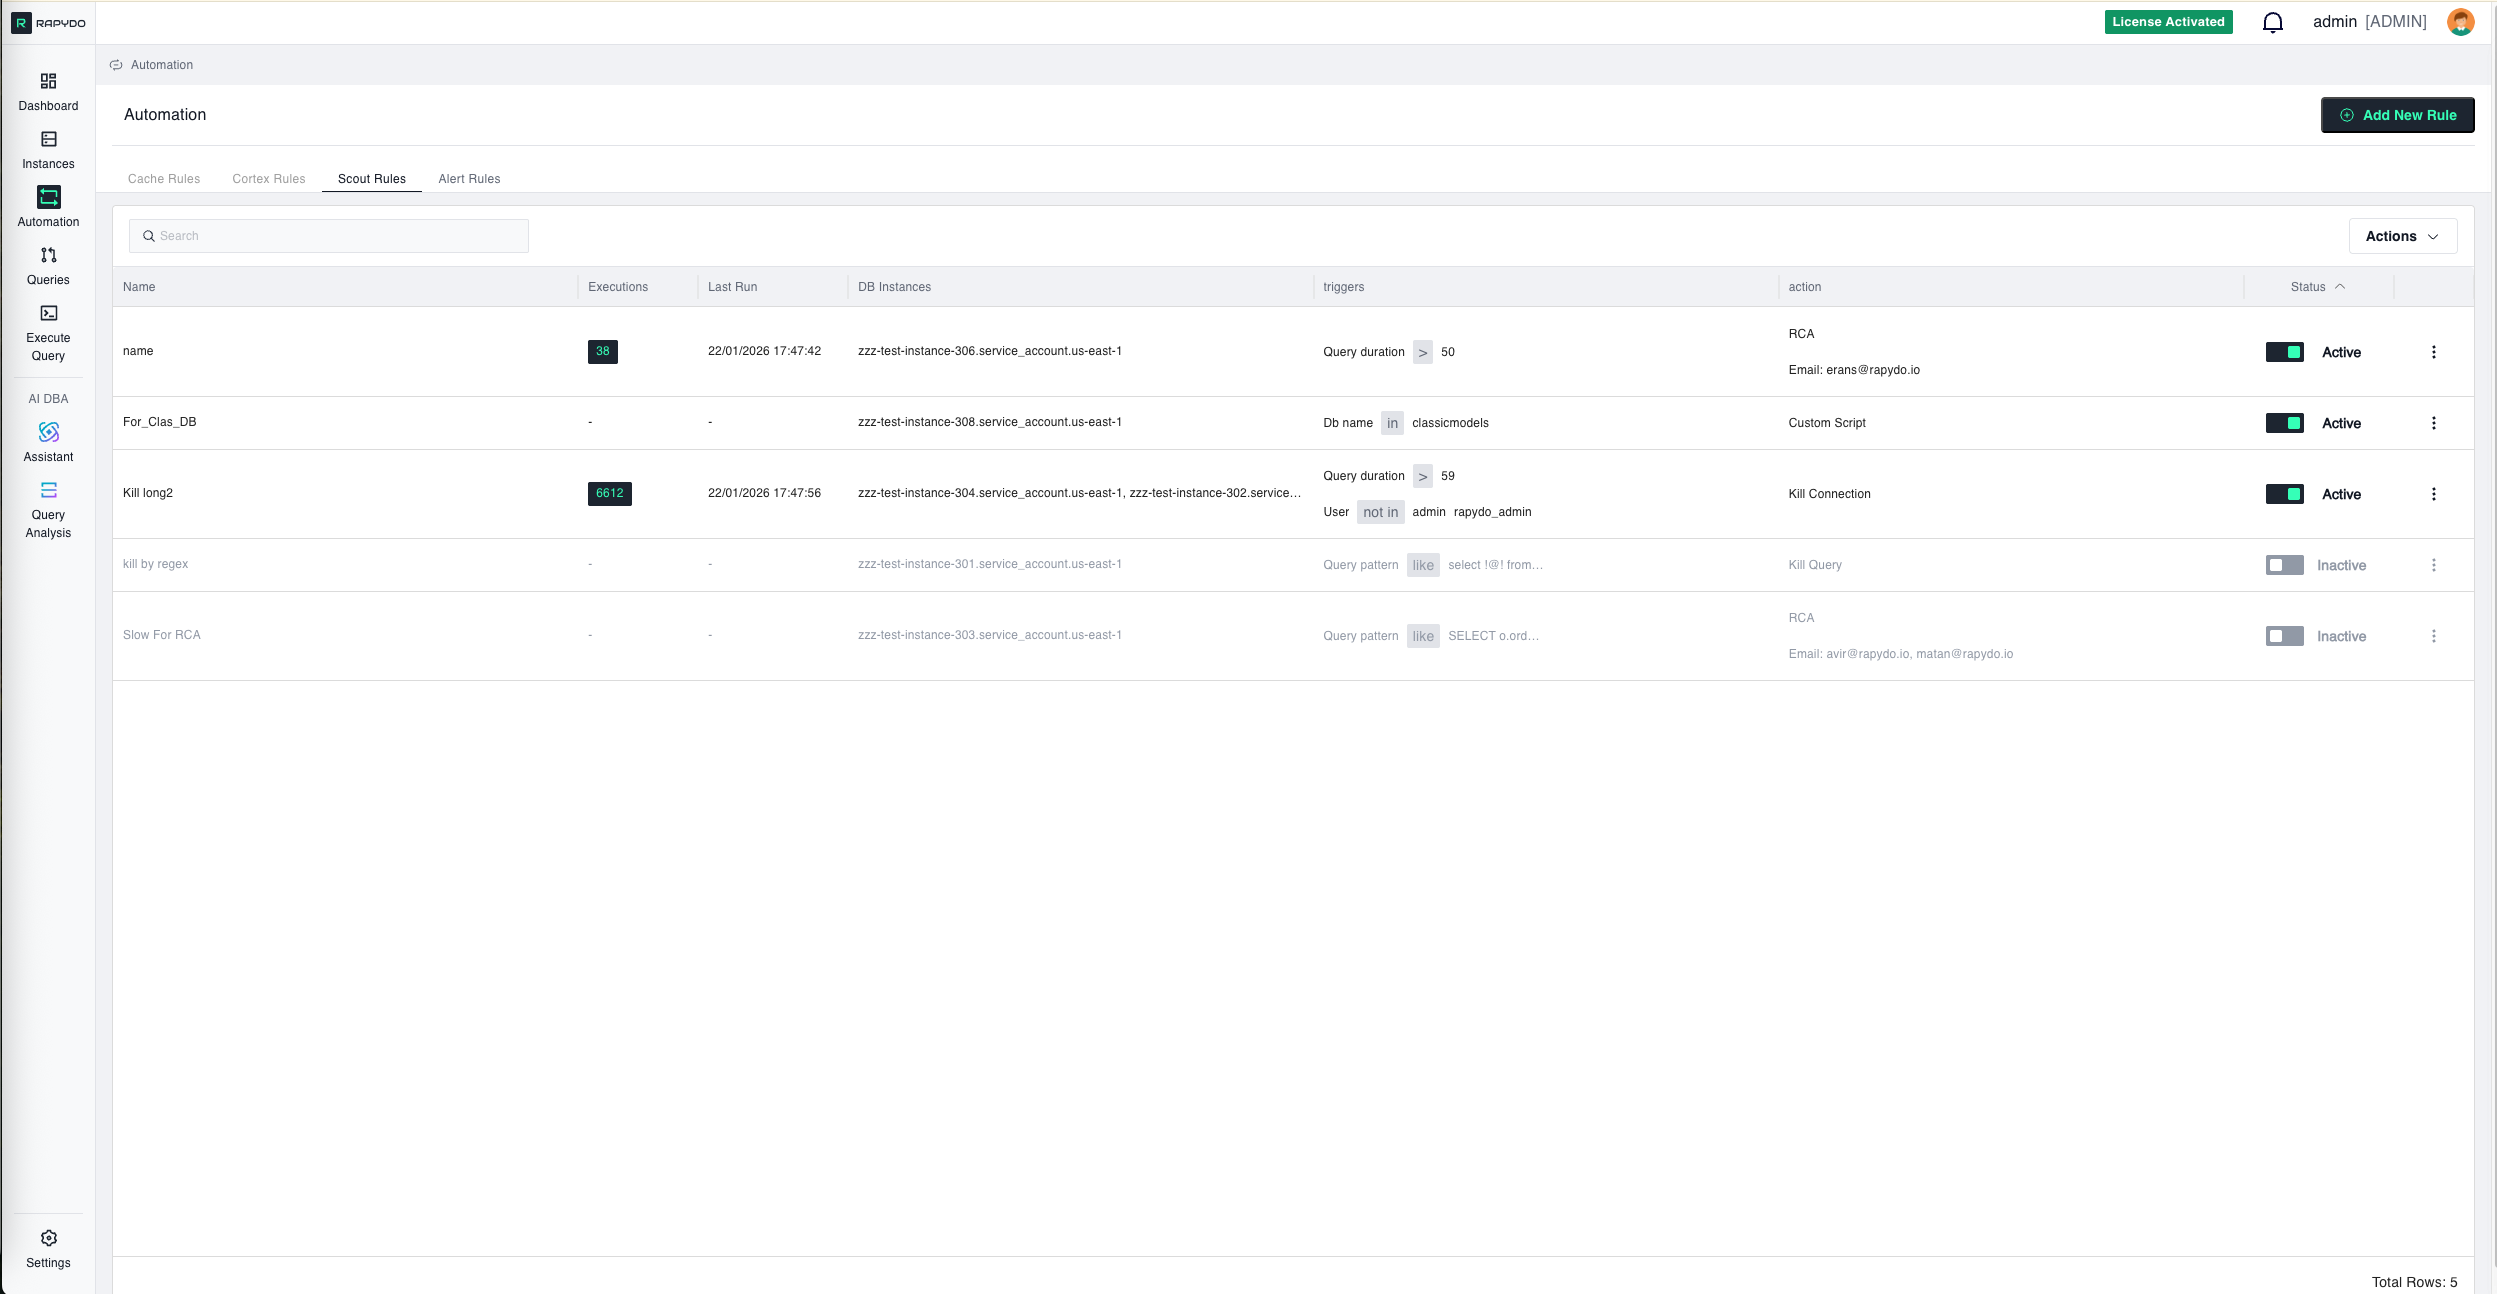
Rule Setup Flow
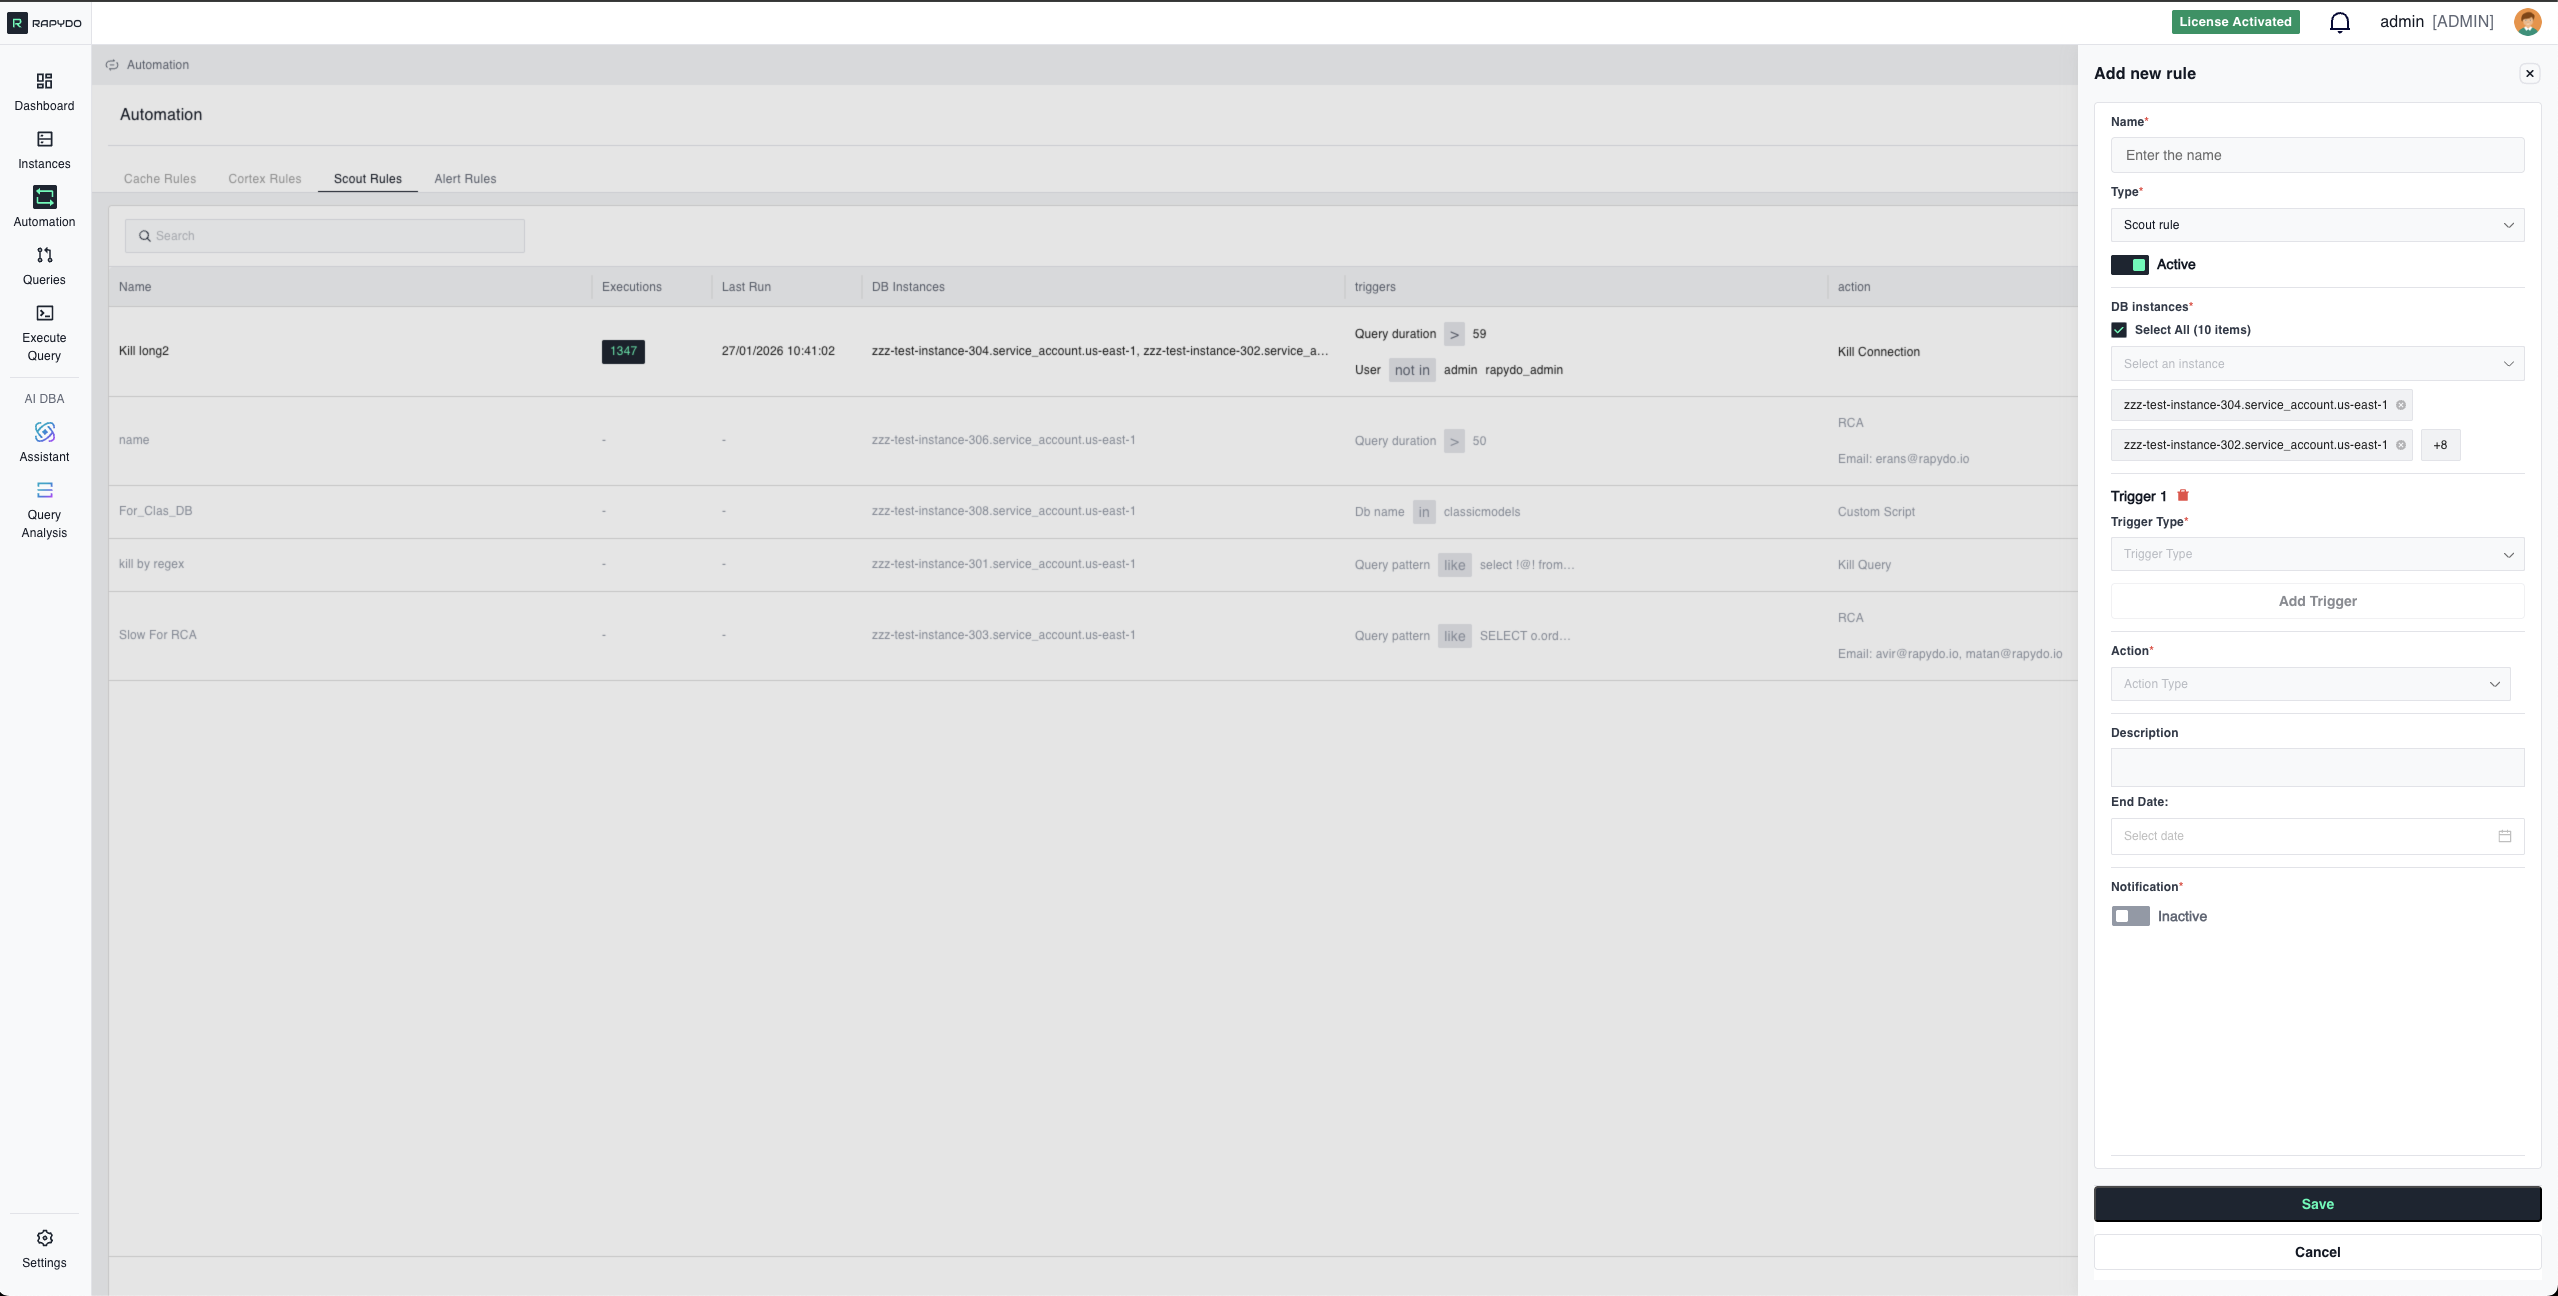
1. DB Instances (Required First Step)
Select which database instances this rule will monitor. Interface: Dropdown with checkboxes- Select All: Choose all available instances at once
- Individual Selection: Pick specific instances
2. Triggers (Up to 3 Maximum)
Configure conditions that will activate your rule. All triggers use AND logic—ALL must be true simultaneously for the rule to trigger.Query Duration
Monitors how long queries have been running. Operator Options:- Greater Than: Trigger when runtime exceeds duration
- Less Than: Trigger when runtime is below duration
- Stop runaway queries that slow the database
- Enforce query timeout policies
- Protect database performance from inefficient queries
- Prevent resource exhaustion from long-running reports
Connection Idle Time
Monitors connections in “sleep” state (connected but not executing queries). Operator Options:- Greater Than: Trigger when idle time exceeds value
- Less Than: Trigger when idle time is below value
- Free up memory from abandoned connections
- Prevent connection pool exhaustion
- Clean up development/test connections left open
- Reclaim resources from inactive sessions
Connection Utilization
Monitors database connection pool usage as percentage (%) of maximum connections. Operator Options:- Greater Than: Trigger when usage exceeds percentage
- Less Than: Trigger when usage falls below percentage
- Prevent “too many connections” errors
- Proactive connection pool management
- Emergency connection cleanup during high load
- Kill idle connections when pool approaches capacity
Query Pattern
Matches running queries against patterns using SQL LIKE syntax with% wildcards.
Interface: Manual text entry
Pattern Behavior:
- The system is case-insensitive and automatically removes semicolons before matching
- Use % wildcard to represent any content:
select % from table_name - Patterns must match query structure exactly (except case and semicolons)
- ⚠️ Critical: Pattern matching is sensitive to spacing and line breaks—extra spaces or different formatting will cause pattern mismatches
- Like: Trigger when queries match the pattern
- Not Like: Trigger when queries don’t match the pattern
% wildcards
Simple Pattern Examples
Security - Detect Destructive Operations:Complex Pattern Examples
Example 1: Simple Query with Wildcards Your rule query pattern:Example 2: Multi-line Query with Multiple Wildcards Original Query:
- Exact line break formatting preserved between original and pattern
- Multiple wildcards (%) used for flexible matching on dates, prices, and countries
- Comments preserved to maintain exact structure
- All spacing and indentation must match exactly
Best Practices for Query Patterns
Recommended Sources for Copy-Paste: Copy query text directly from these sources to ensure exact spacing and formatting:- Rapydo Query Workspace (Process count history, Realtime queries, Query lists)
- Rapydo Dashboard (Longest Query widget)
- Database Query Logs (PostgreSQL pg_stat_statements, MySQL slow query log)
- Application Logs (if they capture full SQL statements)
- Database Audit Trails
Pattern Matching Tips: ✅ Use wildcards liberally for values that change: dates, IDs, amounts ✅ Copy from actual query logs rather than typing manually ✅ Test your pattern on a few real queries before deploying ✅ Keep structural keywords exact (SELECT, FROM, WHERE, JOIN) ❌ Don’t modify spacing after copying—even small changes break matching ❌ Don’t reformat queries for readability—match the actual format
DB Name
Triggers based on which database is being accessed. Interface: Dropdown (shows databases from selected instances only)- Search Function: Find specific databases quickly
- Select All: Choose all databases in the dropdown
- In: Trigger for activity on specified databases
- Not In: Trigger for activity NOT on specified databases
- Production protection: In “production_db” - Apply strict rules to production database
- Development monitoring: Not In “dev_db, test_db” - Monitor non-development access
- Schema-specific rules: In “analytics_db” - Different rules for analytics workload
User
Triggers based on which database user is running processes. Interface: Dropdown (shows users from selected instances only)- Search Function: Find specific users quickly
- Select All: Choose all users in the dropdown
- Shared Indicators: Shows users that exist across multiple instances
- In: Trigger for processes from specified users
- Not In: Trigger for processes NOT from specified users
- Admin monitoring: In “admin, dba, root” - Enhanced monitoring for privileged users
- Service account limits: In “app_user, backup_user” - Control service account query duration
- Developer restrictions: Not In “prod_app_user” - Apply rules to everyone except production app
IP Address
Triggers based on source IP address of database connections. Interface: Manual text entry Format:- Single IP:
192.168.1.100 - Multiple IPs: Comma-separated, no spaces:
192.168.1.100,10.0.0.5 - CIDR notation:
10.0.0.0/8or203.0.113.0/24
- In: Trigger for processes from specified IPs
- Not In: Trigger for processes NOT from specified IPs
- Security monitoring: In “203.0.113.45” - Watch specific suspicious IP
- External access: Not In “10.0.0.0/8” - Monitor connections from outside internal network
- Office restriction: In “203.0.113.0/24” - Limit long queries to office network only
- Cloud environment: Not In “172.16.0.0/12” - Monitor non-VPC connections
Custom Script
Advanced trigger that executes a custom SQL query. If the query returns any data (one or more rows), the rule is considered “triggered” and the associated action will be executed. Interface: Manual text entry (SQL editor) How It Works:- You write a SQL query that checks for a specific condition
- Query runs periodically against RapydoDB (monitoring database)
- If query returns results (rows), trigger activates
- If query returns no results (empty), trigger does not activate
- Kill Query
- Kill Connection
- No action (with notification)
- Custom Script (action)
- Complex business rules: Combine multiple conditions beyond standard triggers
- Time-based rules: “Kill queries running during business hours (9am-5pm)”
- Custom thresholds: “Kill queries when combined CPU + Memory exceeds 150%”
- External integration: Query external monitoring tables
- Advanced patterns: “Kill queries with more than 3 joins AND no index usage”
3. Actions
Kill Query
Terminates only the running query while keeping the connection alive. How It Works:- PostgreSQL: Uses
pg_cancel_backend() - MySQL: Uses
CALL mysql.rds_kill_query()
- Query is slow but you don’t want to disrupt the application connection
- Client can retry or handle the cancellation gracefully
- You want to stop the current operation without closing the session
Kill Connection
Terminates the entire database connection (and all queries from that connection). How It Works:- PostgreSQL: Uses
pg_terminate_backend() - MySQL: Uses
CALL mysql.rds_kill()
- Connection itself is problematic (not just a single query)
- You need to forcibly disconnect a user or application
- Multiple queries from the same connection are causing issues
- Kill Query: Stops the query, keeps connection → Less disruptive
- Kill Connection: Closes connection completely → More aggressive
Kill Idle Connections
Automatically terminates idle connections when connection utilization exceeds a threshold. Includes rate limiting to avoid killing too many connections at once. How It Works:- Monitors connection pool utilization
- When threshold is exceeded, identifies idle connections
- Kills idle connections up to the defined rate limit per cycle
- Continues over multiple cycles until utilization drops below threshold
- Connection pool is approaching maximum capacity
- Many idle connections are consuming resources unnecessarily
- You need gradual cleanup without disrupting all idle sessions at once
- Typically paired with “Connection Utilization > 80%” trigger
- Rate limit prevents killing too many connections simultaneously
Rate Limit
Limits the number of concurrent connections or operations matching the trigger criteria by automatically killing excess connections to reach the defined limit. How It Works:- You define a maximum number of allowed concurrent connections
- When more connections match your triggers, Rapydo counts them
- If count exceeds limit, Rapydo kills enough connections to reach the limit
- Example: Limit = 5, Current = 10 → Kills 5 connections
- Need to enforce concurrent connection limits per user
- Want to prevent a single user/application from monopolizing resources
- Controlling resource usage for specific workloads (reporting, analytics)
Query Analysis (RCA)
Triggers AI-powered query analysis for queries matching the trigger conditions. Results include root cause identification and complete remediation plan sent via email or webhook. Available With These Triggers Only: Query Analysis (RCA) is only available when the rule includes at least one of:- Query Duration
- Query Pattern
- Custom Script
- Query matching triggers is automatically analyzed by Rapydo AI
- Analysis includes:
- Root cause identification (missing indexes, inefficient joins, etc.)
- Step-by-step remediation plan with ready-to-run SQL
- Estimated performance impact
- Table statistics and execution plan details
- Complete analysis report is sent to configured notification targets
Use When:
- You want to understand WHY queries are slow, not just kill them
- Building a knowledge base of query optimization opportunities
- Investigating performance patterns over time
- Educating team on query optimization
Custom Script
Executes a custom SQL script when the rule triggers. Provides maximum flexibility for complex automation scenarios. How It Works:- You write SQL statements that execute when triggers activate
- Scripts can query data, update tables, call procedures, etc.
- Useful for complex logic beyond built-in actions
- Need custom logic beyond standard actions
- Want to identify and kill lock chains (find blocker, kill primary blocker only)
- Execute diagnostic queries when issues occur
- Log events to custom tracking tables
- Call external procedures or webhooks
Notification Only
- Rule monitors for trigger conditions
- When conditions are met, notification is sent
- No queries are killed, no connections terminated
- Event is logged in Rapydo for audit
- Testing rules before enabling aggressive actions
- Gathering data to understand query patterns
- Building baseline metrics before setting kill thresholds
- You want awareness without automatic intervention
- Monitoring for compliance/audit purposes
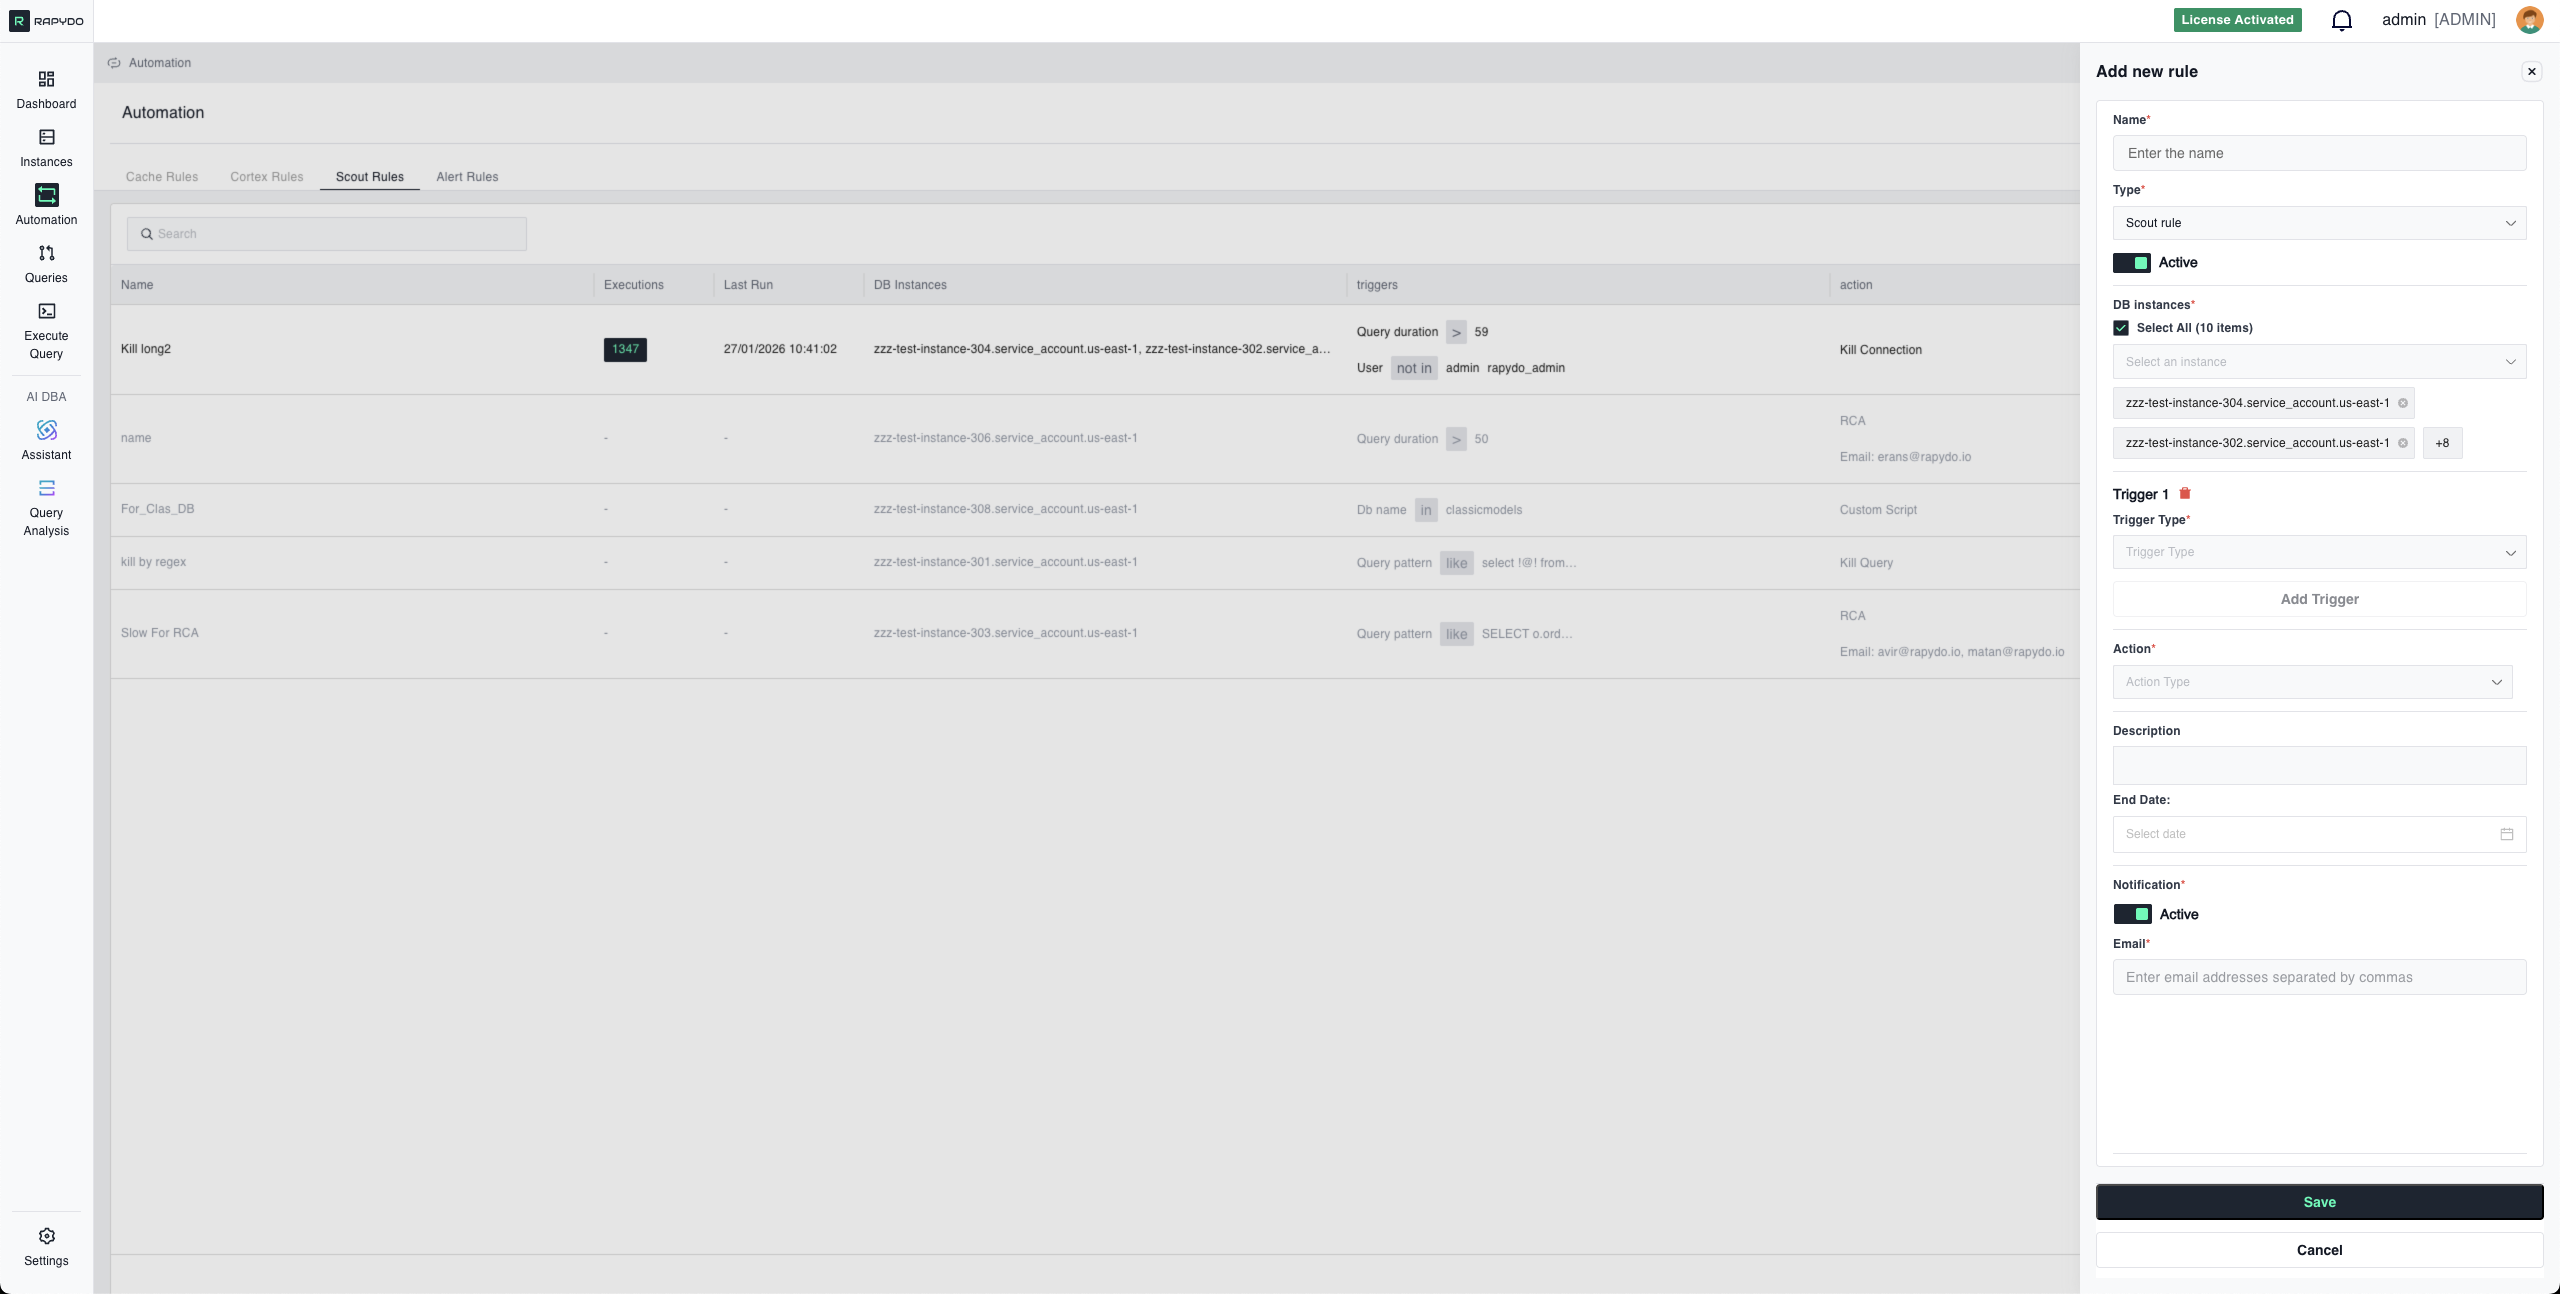
4. Notifications
Toggle: Active/Inactive Notification Method: Choose how to receive alerts:- Email: Enter one or more email addresses (comma-separated)
- Webhook: Enter a webhook URL to receive POST notifications
- Rule triggers and action is executed
- Notification includes:
- Trigger conditions that were met
- Action that was taken
- Query details (SQL text, duration, user, database)
- Instance information
- Timestamp
- Any action type (Kill Query, Kill Connection, Query Analysis, etc.)
- Particularly useful with No action for monitoring without intervention
Multiple Trigger Logic (AND Relationship)
When you configure multiple triggers (up to 3), ALL triggers must be true simultaneously for the rule to activate. How AND Logic Works: Each trigger is evaluated independently:- ✅ If ALL triggers are true → Rule activates, action executes
- ❌ If ANY trigger is false → Rule does not activate
Example 1: Targeted Query Kill
Configuration:- ✅ Running longer than 5 minutes AND
- ✅ From reporting or analytics users AND
- ✅ On production database at the same time
Example 2: Idle Connection Cleanup
Configuration:- ✅ Idle for over 10 minutes AND
- ✅ From test or dev users AND
- ✅ From the specified IP range simultaneously
Example 3: Pattern-Based Monitoring
Configuration:- ✅ Attempt to DROP TABLE AND
- ✅ Are NOT from admin/dba users AND
- ✅ Target production database all at once
Why Use Multiple Triggers?
Precision Targeting:- Avoid killing legitimate queries by being specific
- Example: Kill long queries, but only from specific users
- Multiple conditions create high-confidence rules
- Example: Kill idle connections, but only when from external IPs
- Different thresholds for different users/databases
- Example: 30-second limit for app users, 300-second limit for analysts
Best Practices:
✅ Start with 1-2 triggers and add more as you understand your workload ✅ Test each trigger independently before combining ✅ Use NOT In operators to exclude legitimate traffic ✅ Combine duration + user + database for surgical precision ❌ Don’t over-specify - Too many triggers might never match realityConfiguration Examples
Example 1: Kill Long-Running Queries (Simple)
Scenario: Stop queries that run too long Configuration:Example 2: Cleanup Idle Connections (Multi-Trigger)
Scenario: Free resources from abandoned development connections Configuration:Example 3: Rate Limit Reporting User
Scenario: Prevent reporting user from monopolizing connections Configuration:Example 4: Kill Dangerous Query Patterns
Scenario: Terminate destructive operations from non-admin users Configuration:Example 5: Analyze Slow Analytics Queries
Scenario: Build optimization knowledge base for analytics workload Configuration:Execution Logs
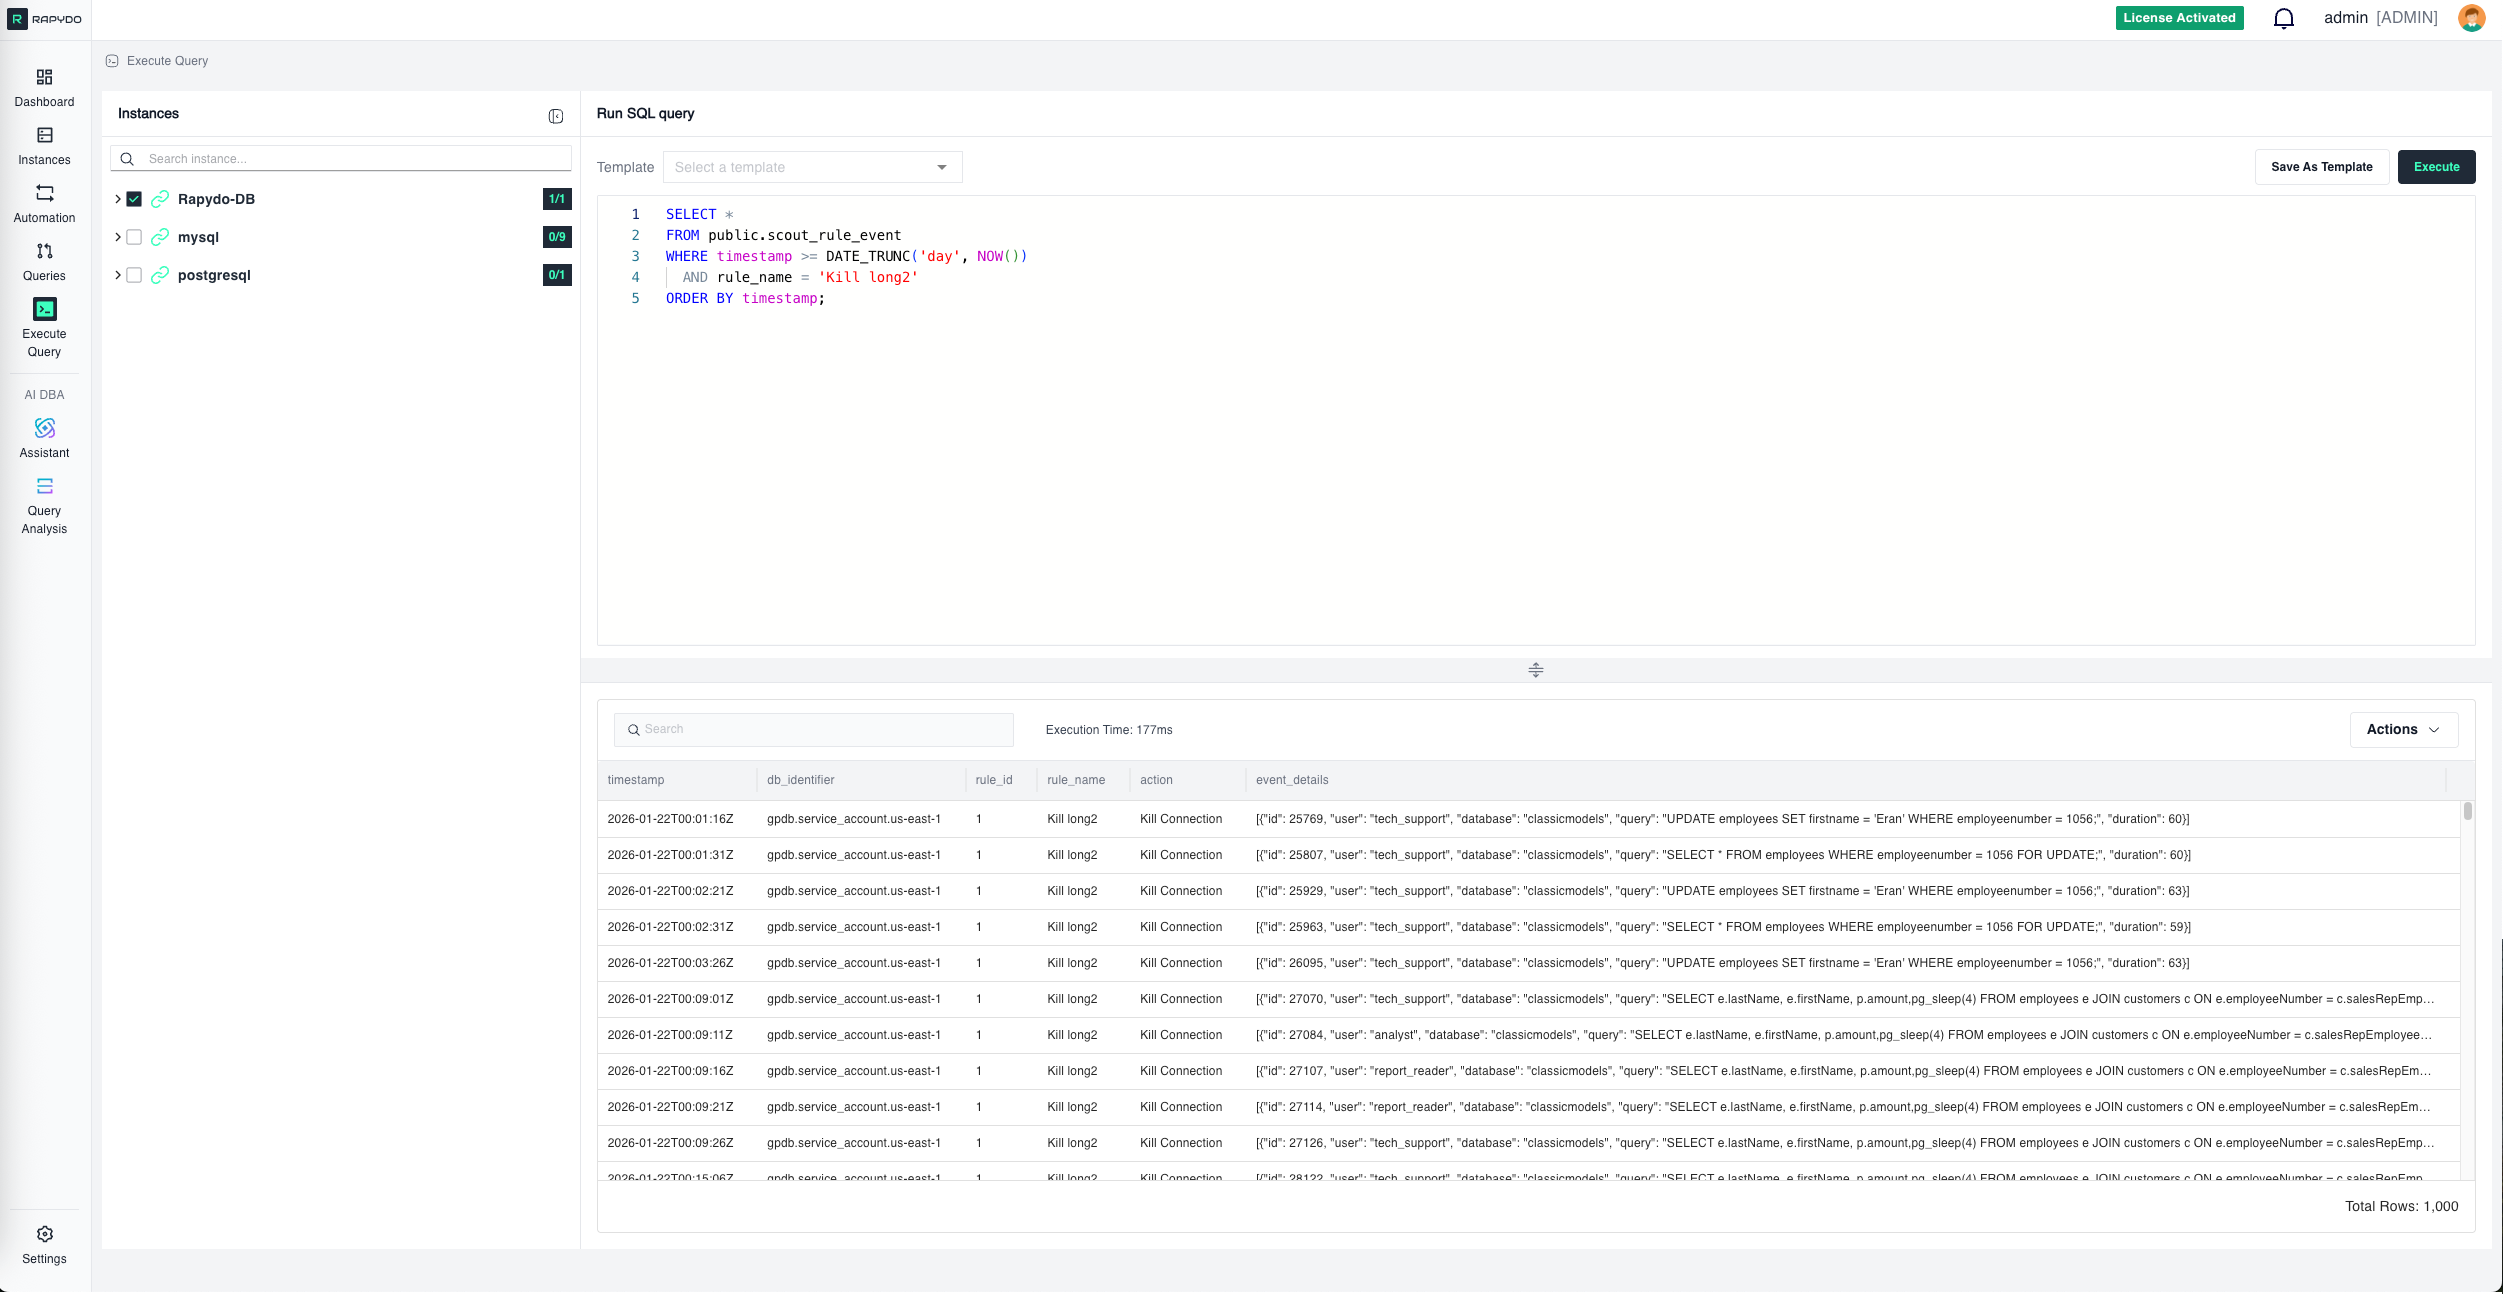
Best Practices
✅ Start with No action + notification before enabling kill actions—understand query patterns first ✅ Use Query Pattern carefully - Copy exact formatting from real queries, not from documentation ✅ Test rules in non-production before deploying to critical databases ✅ Combine triggers with AND logic to avoid killing legitimate queries ✅ Set appropriate thresholds based on actual workload, not arbitrary numbers ✅ Enable notifications to maintain visibility even with automatic actions ✅ Review killed query logs regularly to ensure rules aren’t too aggressiveTroubleshooting
Rule Not Triggering
Check:- All triggers are being met simultaneously (remember AND logic)
- Query pattern formatting matches exactly (spacing, line breaks)
- Selected DB instances include the databases where queries are running
- User/DB name/IP filters are not too restrictive
- Rule status is Active, not Disabled
Query Pattern Not Matching
Solutions:- Copy query directly from Rapydo Query Workspace or query logs
- Don’t manually type or reformat—preserve exact spacing
- Use
%wildcards for values that change (dates, IDs, amounts) - Test pattern against real query text before deploying
- Remember: case-insensitive but spacing-sensitive
Too Many Queries Being Killed
Solutions:- Add more specific triggers (user, database, IP)
- Increase duration thresholds
- Use NOT In operators to exclude legitimate traffic
- Switch to No action + notification to monitor before killing
- Review killed query logs to identify patterns
Rate Limit Not Working
Check:- Trigger correctly identifies the connections to limit
- Rate limit value is appropriate for workload
- Connections are actually matching all trigger criteria
- Multiple users aren’t being lumped together unintentionally
What’s Next?
- Defining Rules - Step-by-step guide to creating rules
- Alert Rules Reference - Complete Alert Rules documentation
- Automation Overview - Return to automation overview