Overview
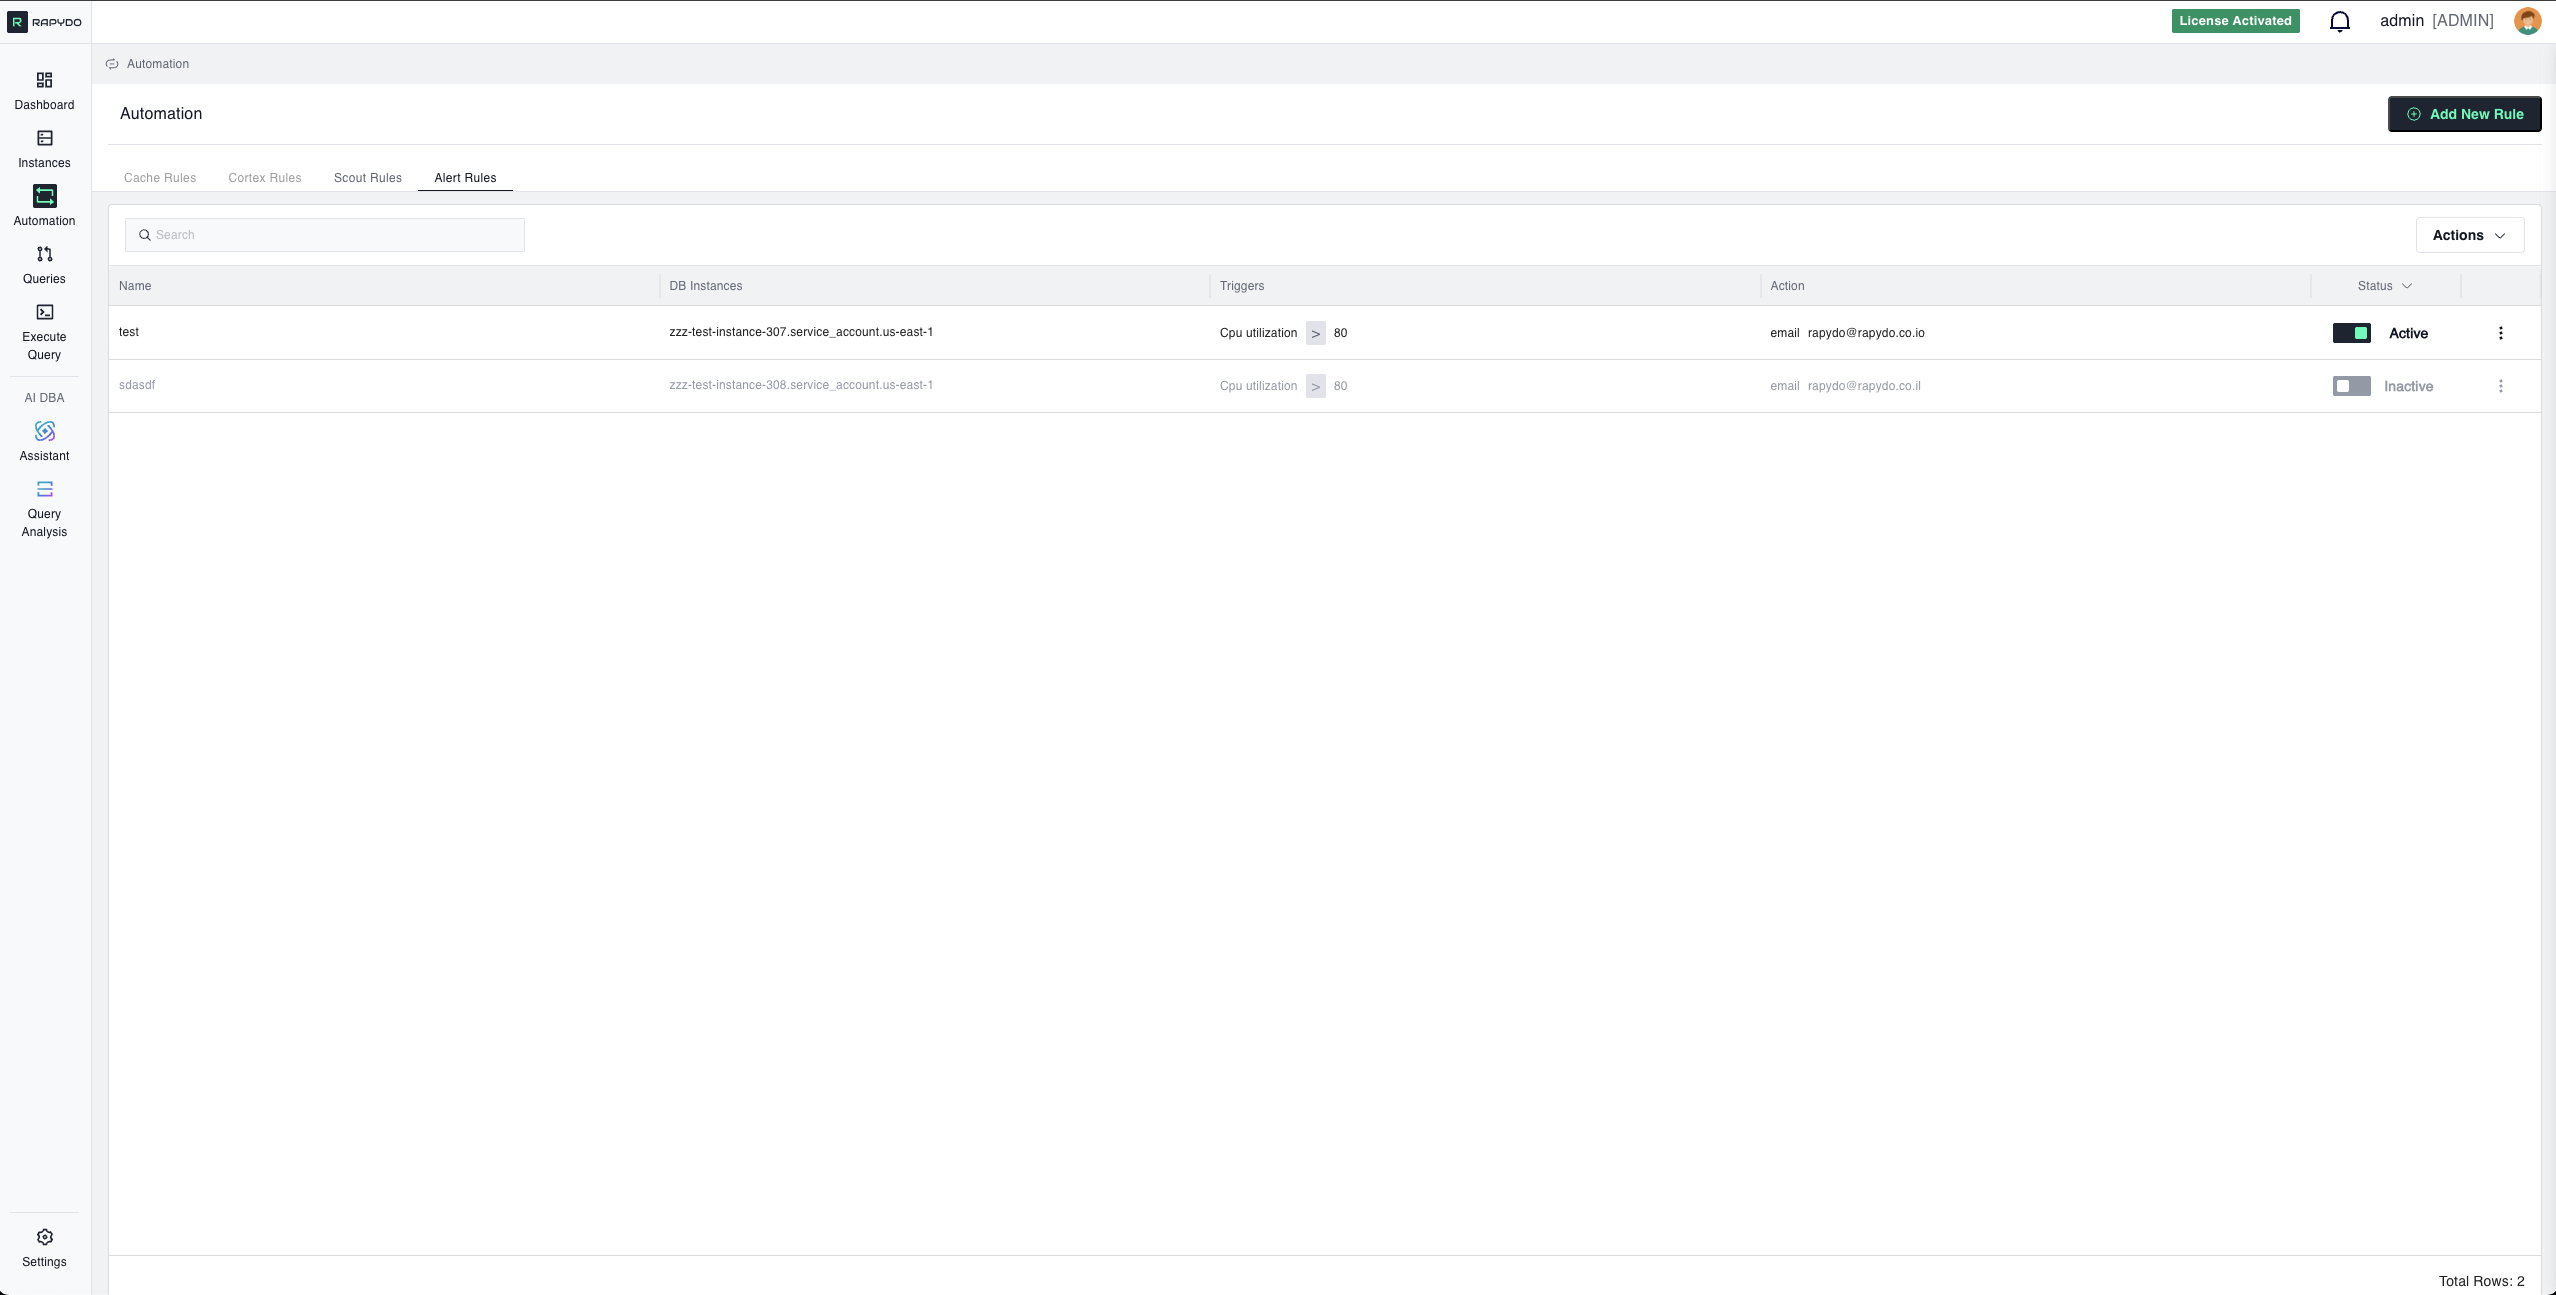
Core Concepts
- Example: CPU Utilization exceeds 90%
- Example: Free Memory drops below 2048 MB
- Example: Send email notification
- Example: Send webhook to a channel
- Select All: Apply to all monitored instances
- Specific Instances: Target individual databases
Available Metric Types
Resource Utilization
CPU Utilization- Measures processor usage across database instances
- Unit: Percentage (%)
- Use when: Monitoring compute resource consumption
- Example: Alert when CPU > 80%
Free Memory
- Available RAM on the database instance
- Unit: Megabytes (MB)
- Use when: Preventing out-of-memory errors
- Example: Alert when Free Memory
<2048 MB
Read IOPS
- Input/output operations per second (reads)
- Unit: Operations per second
- Use when: Monitoring disk read performance
- Example: Alert when Read IOPS > 5000
Write IOPS
- Input/output operations per second (writes)
- Unit: Operations per second
- Use when: Monitoring disk write performance
- Example: Alert when Write IOPS > 3000
Query Performance
Max Query Duration- Duration of the longest-running query
- Unit: Seconds
- Use when: Detecting slow queries impacting performance
- Example: Alert when Max Query Duration > 60 seconds
Connection & Activity
Connections Count- Number of active database connections
- Unit: Count (integer)
- Use when: Monitoring connection usage
- Example: Alert when Connections Count > 200
Connection Utilization
- Percentage of maximum connections in use
- Unit: Percentage (%)
- Use when: Preventing connection pool exhaustion
- Example: Alert when Connection Utilization > 90%
DB Count
- Number of database schemas on the instance
- Unit: Count (integer)
- Use when: Detecting unexpected database creation/deletion
- Example: Alert when DB Count > 10
Users Count
- Number of unique users connected to the database
- Unit: Count (integer)
- Use when: Monitoring user activity patterns
- Example: Alert when Users Count > 50
Hosts Count
- Number of unique client hosts with connections
- Unit: Count (integer)
- Use when: Detecting unusual connection sources
- Example: Alert when Hosts Count > 100
Waits Count
- Number of queries currently in wait state
- Unit: Count (integer)
- Use when: Detecting blocking or resource contention
- Example: Alert when Waits Count > 20
Metric Operators
Use operators to define threshold conditions for your metrics: Greater than- Symbol:
> - Alert when metric exceeds the threshold
- Example:
CPU Utilization > 80%
- Symbol:
>= - Alert when metric meets or exceeds the threshold
- Example:
CPU Utilization >= 80%
- Symbol:
< - Alert when metric falls below the threshold
- Example:
Free Memory < 2048 MB
- Symbol:
<= - Alert when metric meets or falls below the threshold
- Example:
Free Memory <= 2048 MB
Notification Methods
- Send email notification to specified recipients
- Configuration:
- Recipients: List of email addresses (comma-separated)
- Subject: Auto-generated based on trigger
- Content: Metric values, threshold, timestamp, instance details
- Mail per instance: Toggle to control how alerts are grouped
- Checked: A separate email is sent for each database that triggers the alert
- Unchecked: A single summary email covers all triggered databases
Webhook
- Send HTTP POST request to configured webhook URL
- Configuration:
- Webhook Destinations: Select from configured webhooks (Settings → Webhook)
- Payload: JSON containing alert details
- Slack (via Incoming Webhooks)
- Microsoft Teams (via Incoming Webhook connector)
- PagerDuty (via Events API)
- Custom alerting systems
- Go to Settings → Webhook
- Configure your webhook URL
- Test the connection
- Select the webhook when creating Alert Rules
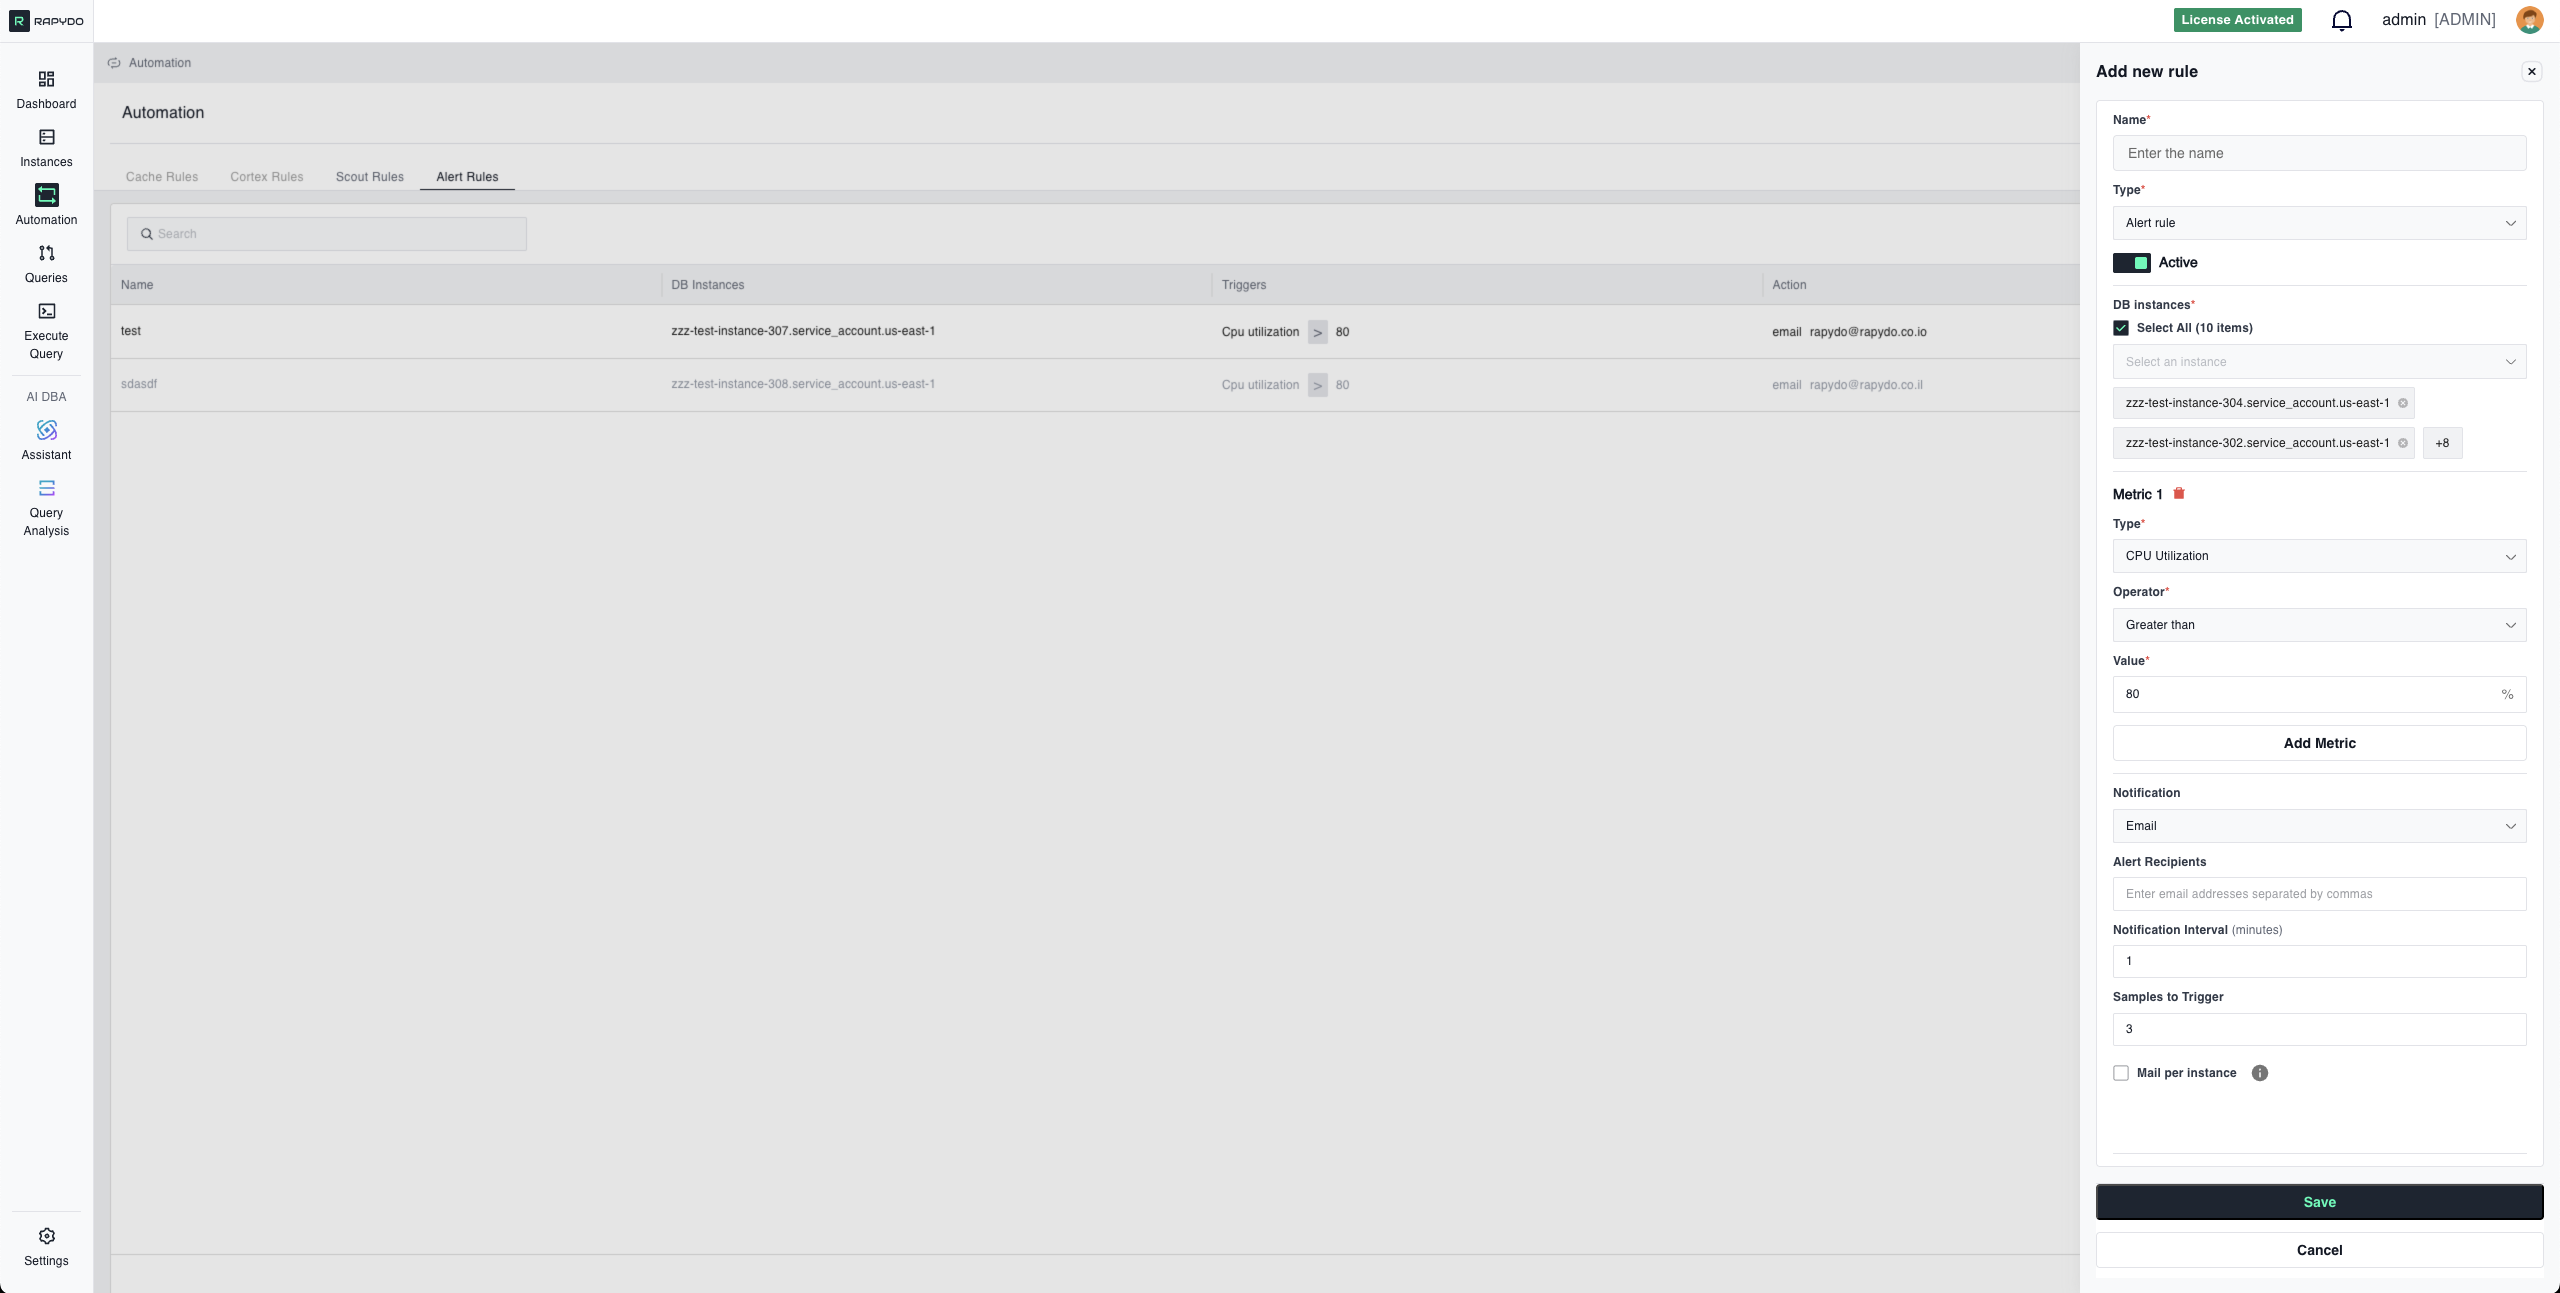
Configuration Parameters
Samples to Trigger
Number of consecutive checks that must exceed the threshold before alerting. Purpose: Prevents false alerts from temporary spikes Example:- Volatile metrics (CPU, IOPS): 4-5 samples
- Critical failures (Connection Utilization): 1-2 samples
- Gradual changes (Memory): 3-4 samples
Notification Interval
Minimum time (in minutes) between repeated alerts for the same condition. Purpose: Prevents alert flooding while keeping you informed Example:- Critical alerts: 3-5 minutes
- Warning alerts: 15-30 minutes
- Informational alerts: 60+ minutes
Multi-Metric Rules (AND Logic)
Combine multiple metrics to create sophisticated monitoring conditions. All specified conditions must be true simultaneously for the rule to trigger.How AND Logic Works
When you add multiple metrics to a single Alert Rule, the rule only triggers when ALL conditions are met at the same time. Example - High CPU AND High Connections:- ✅ CPU is above 85% AND
- ✅ Connections exceed 200 at the same time
Why Use Multi-Metric Rules?
Reduce False Positives Single metrics can trigger during normal operations. Combining metrics creates high-confidence alerts. Example:- High CPU alone might be normal during batch jobs
- High Connections alone might be normal during peak hours
- High CPU + High Connections together suggests a real performance issue
Identify Specific Scenarios Multi-metric rules let you target exact situations that matter. Examples: Performance Degradation:
Resource Saturation:
Memory Pressure with High Activity:
Best Practices for Multi-Metric Rules
✅ Combine 2-3 metrics for balance between specificity and maintainability ✅ Use complementary metrics that indicate the same underlying issue from different angles ✅ Test each metric individually first to understand their behavior before combining ✅ Avoid too many metrics - 4+ conditions can make rules too specific and miss real issues ❌ Don’t combine unrelated metrics - CPU + DB Count makes little senseConfiguration Examples
Example 1: High CPU Alert (Single Metric)
Scenario: Alert when CPU remains elevated Configuration:Example 2: Low Memory Warning (Single Metric)
Configuration:Example 3: Connection Pool Saturation (Single Metric)
Configuration:Example 4: Performance Degradation (Multi-Metric)
Configuration:Example 5: Resource Saturation (Multi-Metric)
Configuration:Best Practices
✅ Use appropriate Samples to Trigger values to avoid false positives from transient spikes ✅ Set Notification Intervals that balance awareness with alert fatigue ✅ Combine metrics with AND logic to create high-confidence alerts and reduce false positives ✅ Test rules in non-production before deploying to critical instances ✅ Use webhook for team channels (Slack, Teams) and email for individual recipients — each rule supports one notification method ✅ Review and adjust thresholds based on actual workload patterns ✅ Start with single-metric rules and add additional metrics as you understand your environmentTroubleshooting
Alert Not Triggering
Check:- Samples to Trigger count is reasonable for your metric check frequency
- Thresholds are appropriate for actual metric values
- For multi-metric rules, verify ALL conditions are being met simultaneously
- Rule status is Active, not Disabled
- Selected databases are correct
Too Many Alerts
Solutions:- Increase Samples to Trigger to require sustained issues
- Increase thresholds to appropriate levels
- Extend Notification Interval to reduce frequency
- Add additional metrics with AND logic to make the rule more specific
Alerts Stop After First Notification
Check:- Notification Interval is set (not too high)
- Rule is still Active
- Condition is still met (metric hasn’t dropped below threshold)
- For multi-metric rules, all conditions are still true
Multi-Metric Rule Never Triggers
Check:- Monitor each metric individually to see if they align timing-wise
- Conditions might not occur simultaneously - consider if they should be separate rules
- Thresholds might be too strict when combined
What’s Next?
- Defining Rules - Step-by-step guide to creating rules
- Scout Rules Reference - Complete Scout Rules documentation
- Automation Overview - Return to automation overview