Defining Throttling Rules and Tracking Query Behavior
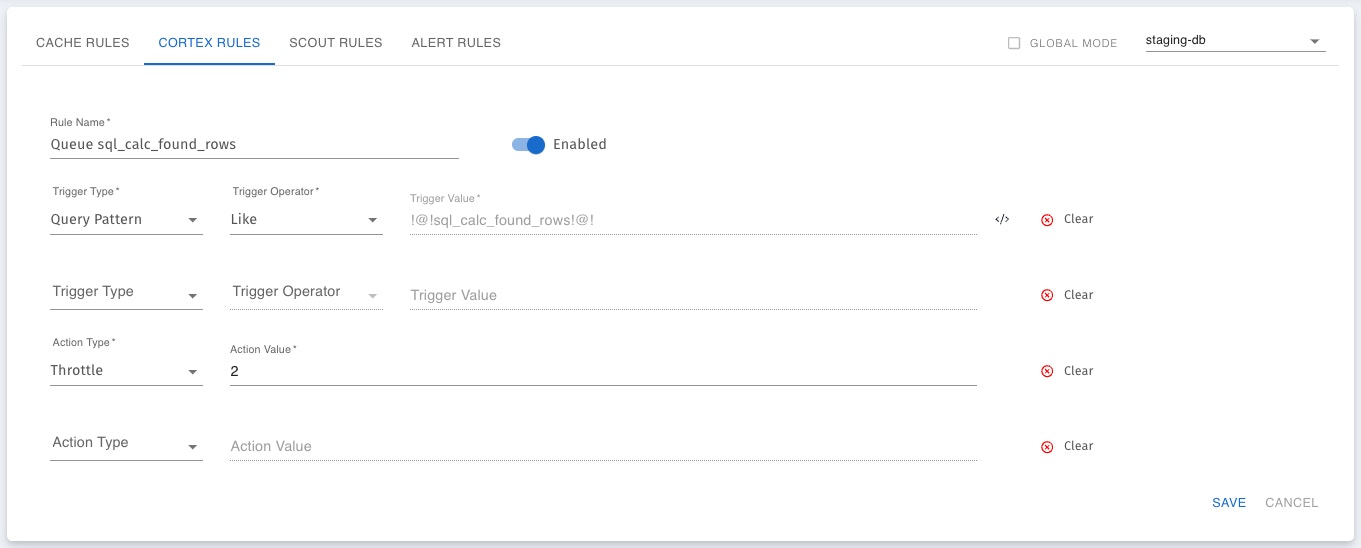
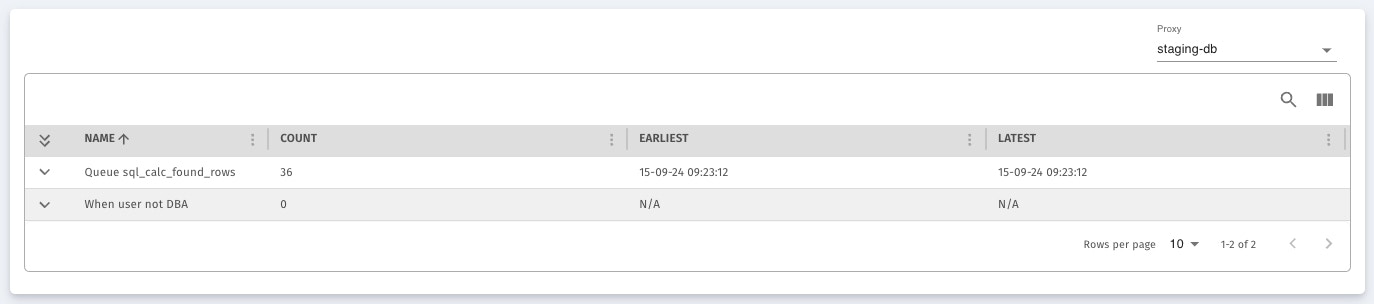
To leverage the power of automated query throttling, users need to define specific rules that govern when and how throttling is applied. These rules are highly customizable, allowing users to tailor them to their specific database workloads. Here’s how to define and monitor throttling rules in the system: Rule Definition:- Rule Name: Each throttling rule begins with a descriptive name that clearly identifies its purpose. For example, Queue_sql_calc_found_rows indicates that this rule targets queries using the sql_calc_found_rows clause.
- SQL Pattern Matching: The core of the throttling rule is the SQL pattern it matches. This pattern tells the system which queries to target for throttling. In this case, the rule is triggered whenever a query contains the sql_calc_found_rows keyword, which is known to be resource-intensive. By using pattern matching, the system can easily identify and throttle problematic queries without needing to specify every possible query individually.
- Throttle Value: The throttle value sets the limit on how many queries matching the pattern can run concurrently. For example, setting the throttle value to 2 ensures that no more than two queries containing sql_calc_found_rows are executed at the same time. Any additional queries matching the pattern will be queued until one of the throttled queries completes. This prevents the database from being overloaded by multiple intensive queries running simultaneously.
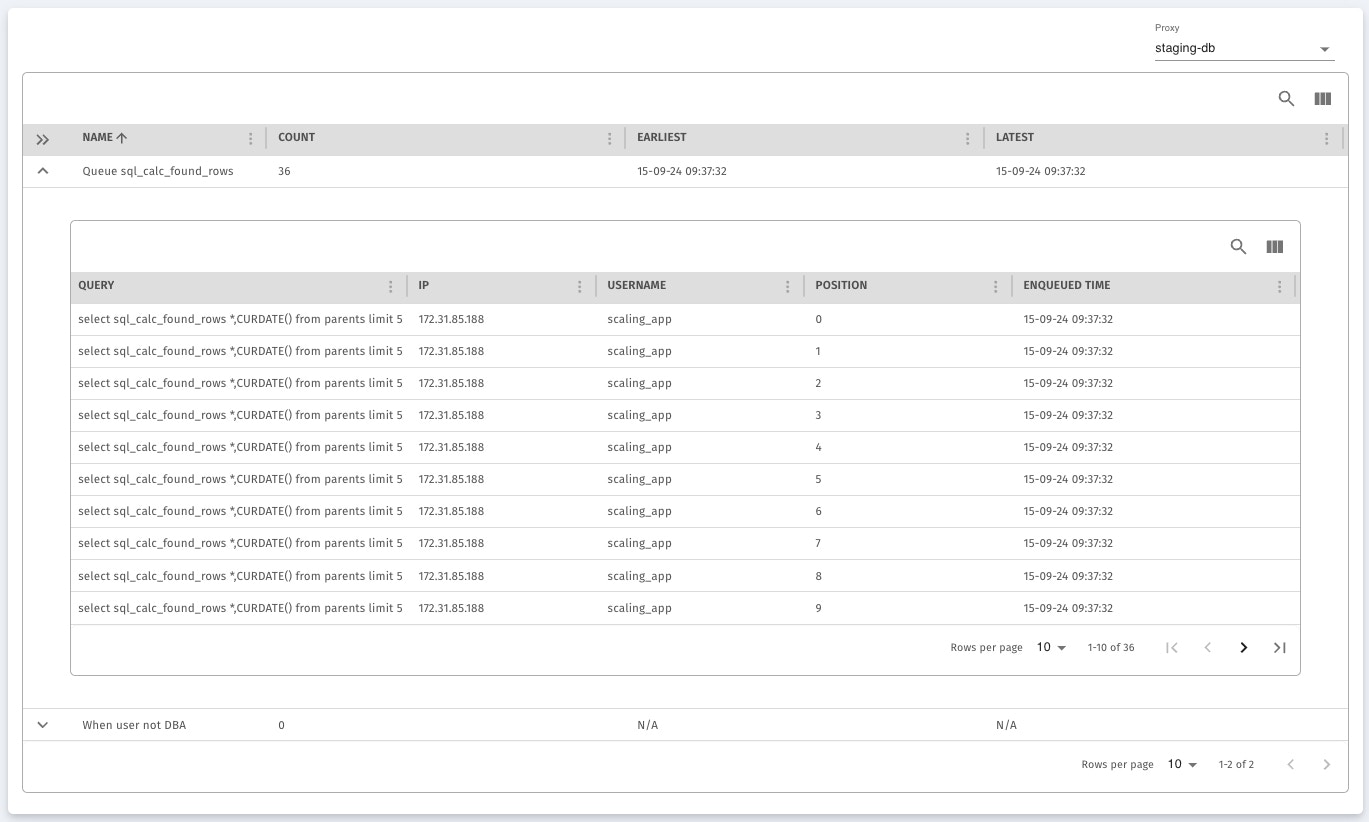
- Once a throttling rule is active, users can monitor its effectiveness by viewing details about the queries that have been throttled. The query view provides a comprehensive overview of these queries, including:
- SQL Query: The full text of the query that has been throttled, allowing administrators to understand exactly which queries are being impacted by the rule.
- IP Address: The IP address of the user or application that submitted the query, helping to identify the source of the throttled queries.
- Username: The database user associated with the query, providing additional context for troubleshooting or auditing purposes.
- Queue Position: The position of the throttled query in the execution queue. This indicates how long the query will need to wait before it can be executed.
- Enqueued Time: The time at which the query was enqueued for throttling, helping to track how long queries have been delayed.
- The full SQL query being throttled.
- The IP address (172.31.85.188) of the user or application that submitted the query.
- The username (scaling_app) associated with the query.
- The position of the query in the throttling queue, indicating how many queries are ahead of it.
- The time at which the query was enqueued for throttling, providing a sense of how long the query has been delayed.