Overview
- Root cause identification — Pinpoint exactly why queries are slow
- Remediation plans — Step-by-step implementation guidance with ready-to-run SQL
- Impact estimates — Understand expected performance improvements before making changes
- Supporting evidence — Complete technical details backing every recommendation
Getting Started
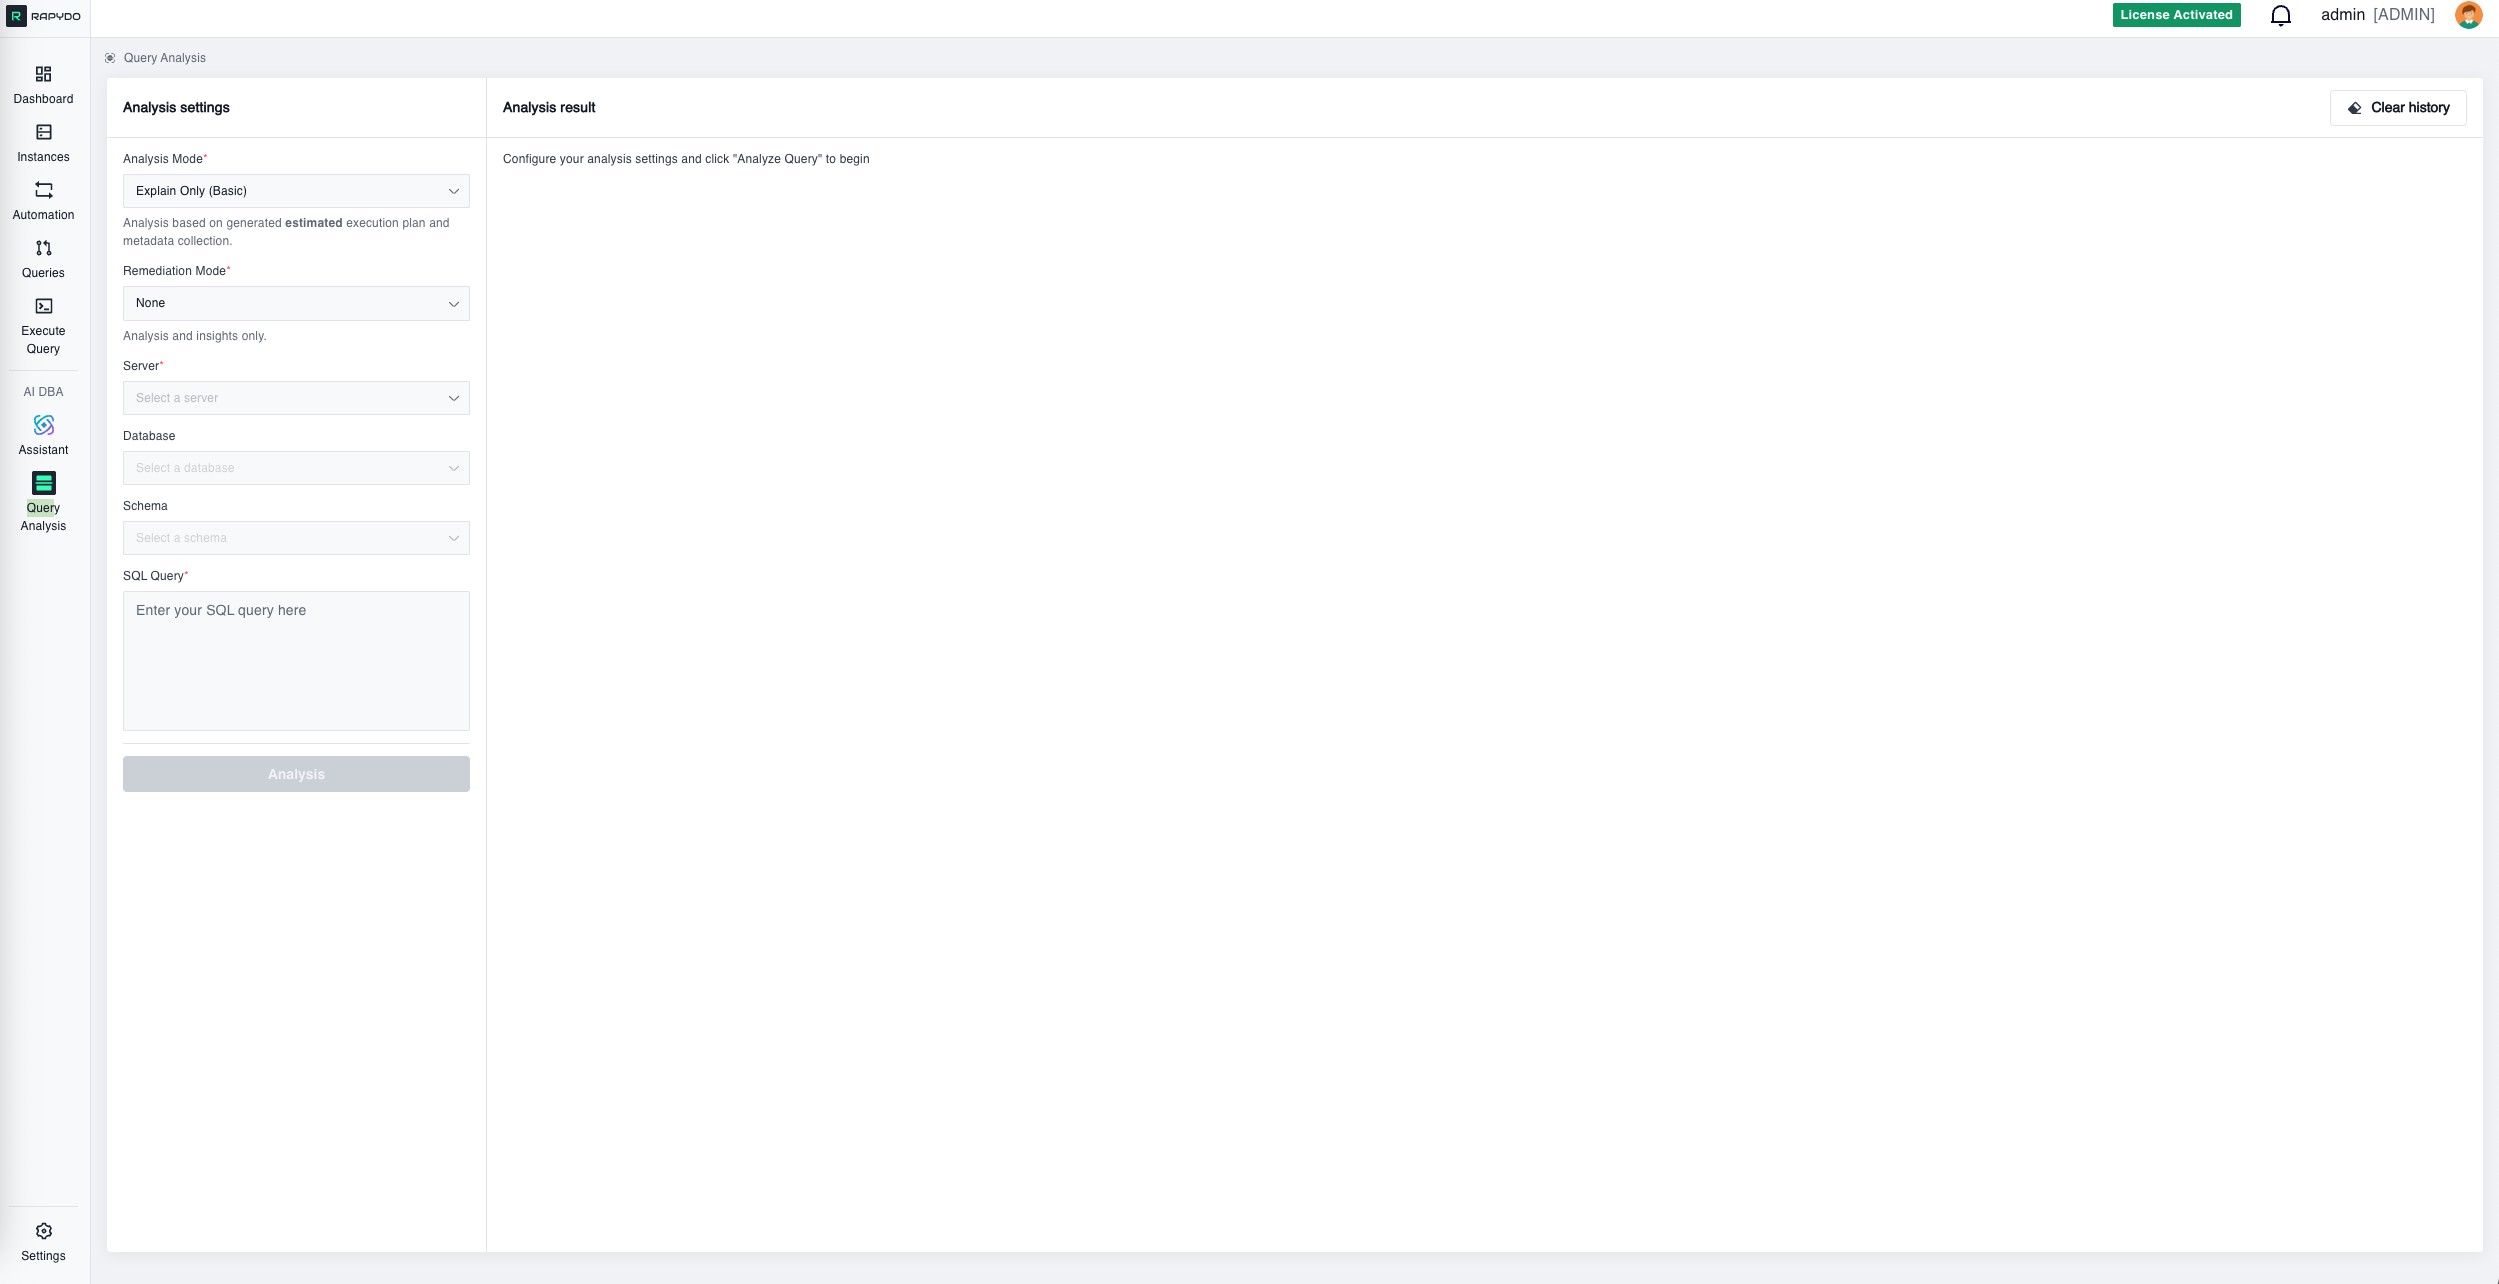
Analysis Settings
Configure your analysis with these required fields: Analysis Mode — Select the type of execution plan analysis:- Explain Only (Basic) — Generates an estimated execution plan based on table statistics and metadata. Fast and safe for production use since the query is not actually executed.
- Explain Analyze (Advanced) — Actually executes the query and measures real performance metrics. Provides accurate row counts and timing data instead of estimates. Use with caution on production systems as the query will run.
Ways to Access Query Analysis
Direct Entry
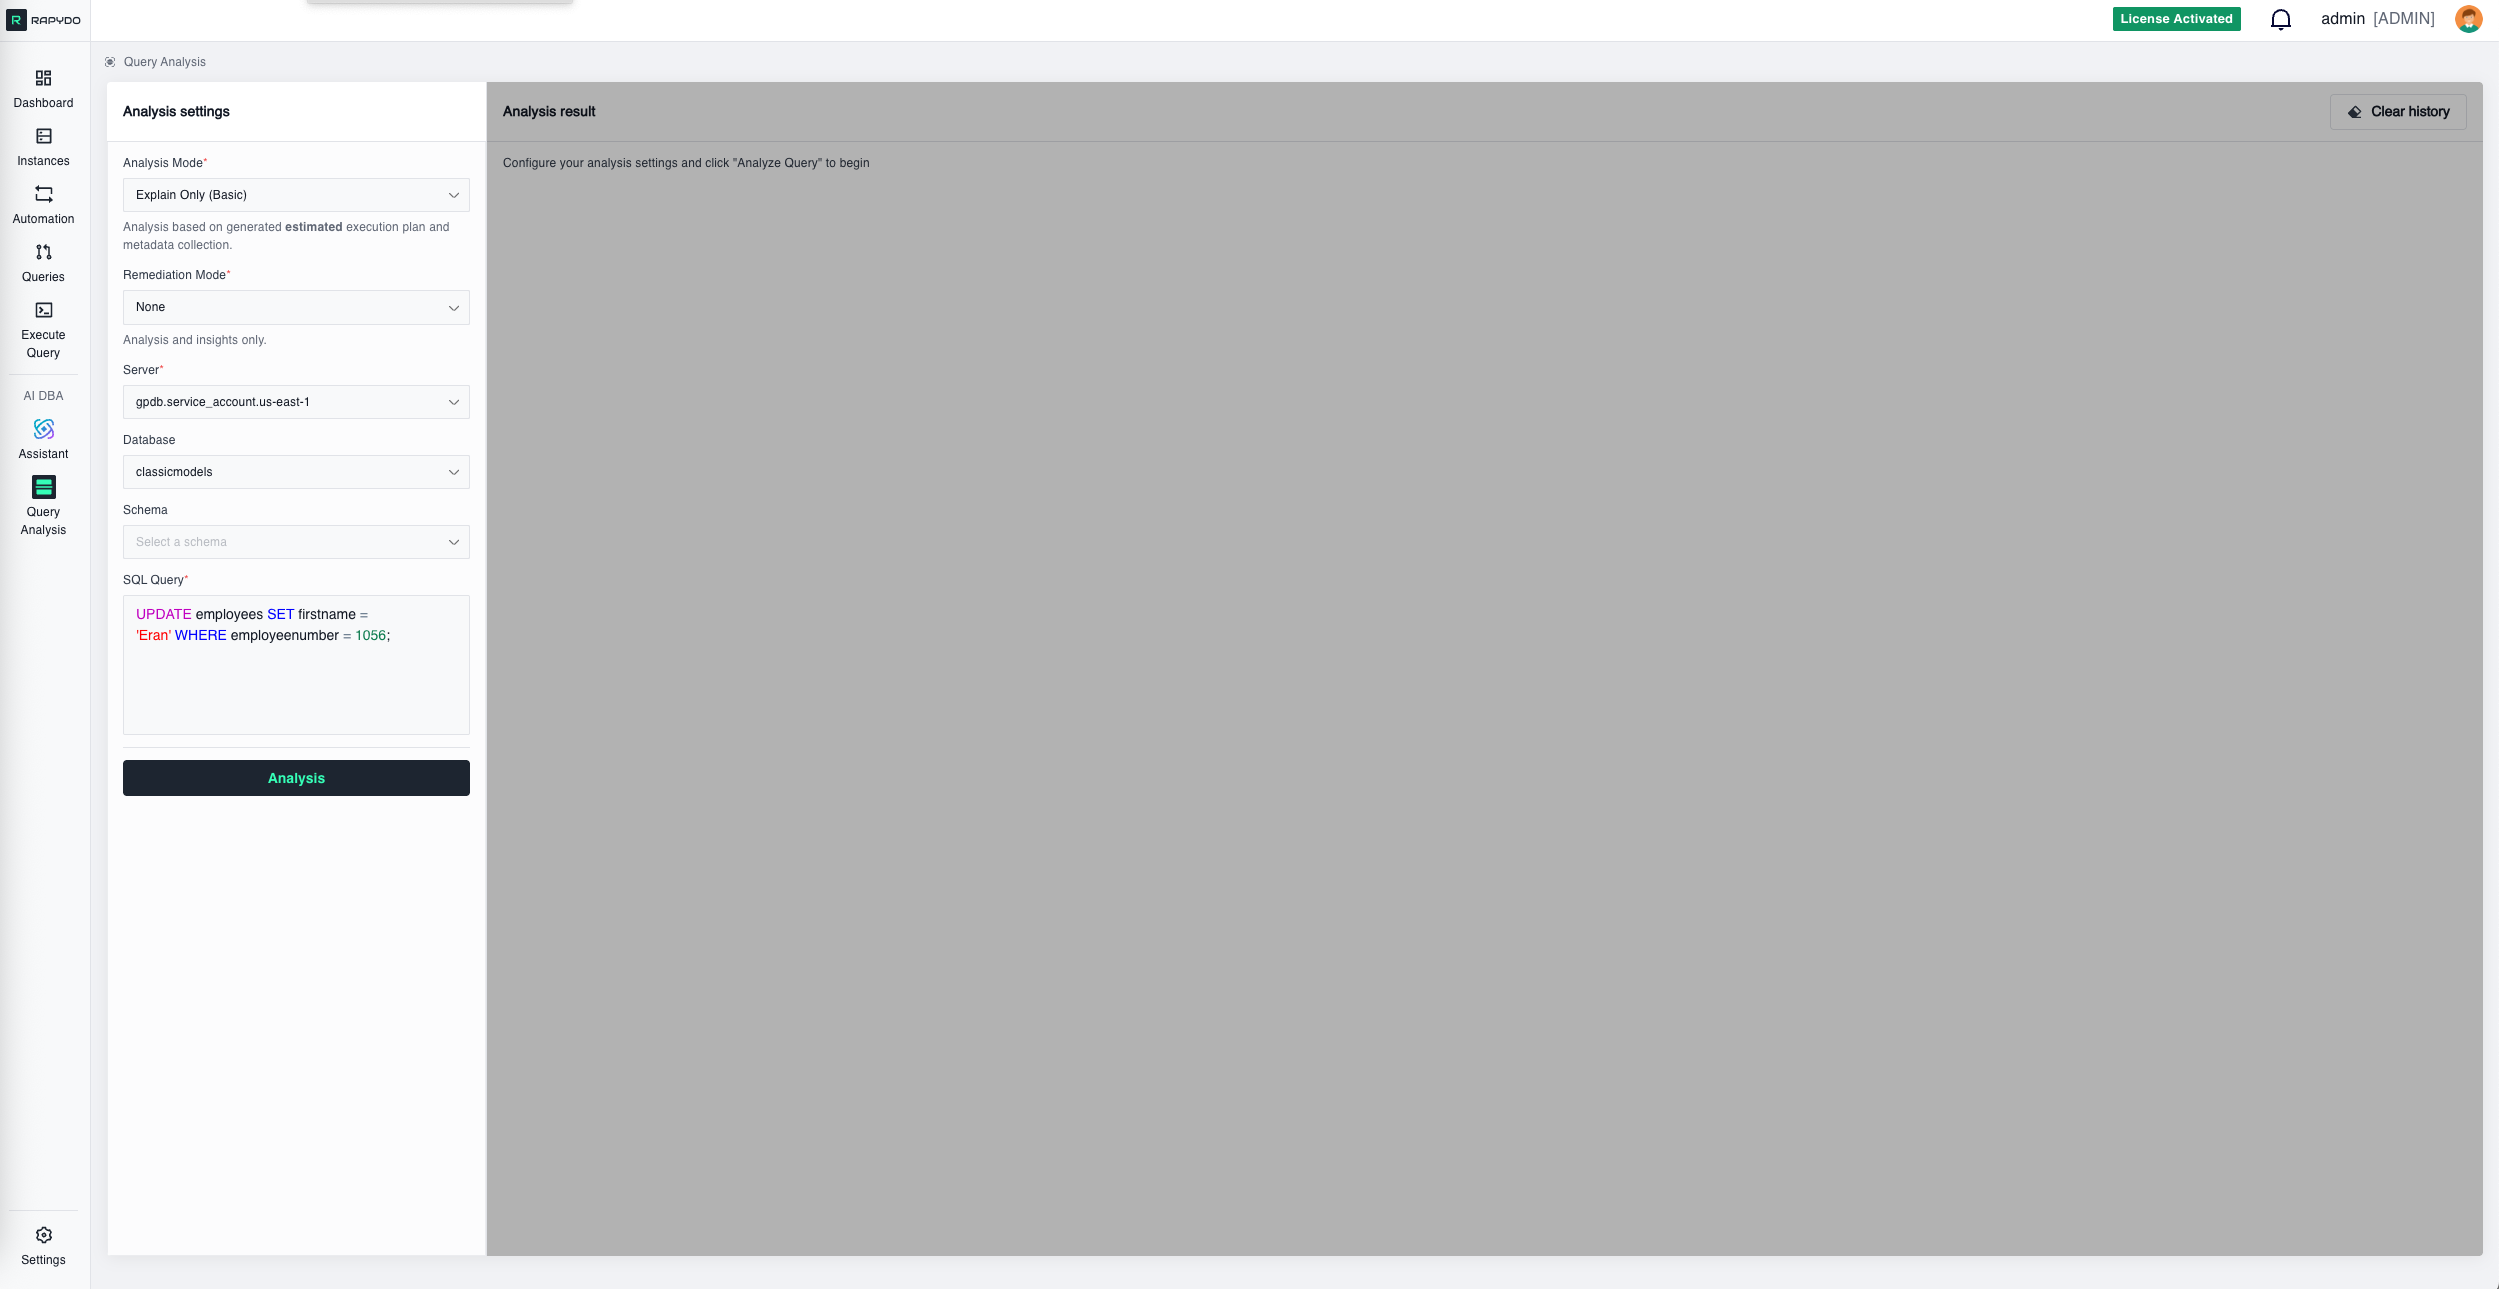
Navigate to Query Analysis and manually enter your server, database, and SQL query.From Query Workspace
When viewing queries in any query workspace (like Process count history or other query lists), hover over any query row to reveal the Analyze Query button. Clicking it opens Query Analysis with all required fields automatically populated—server, database, and query are pre-filled and ready for one-click analysis.From Dashboard
Dashboard widgets like Longest Query and Query Avg Time display your slowest queries. Each query row includes an Analyze Query button that opens Query Analysis with all fields pre-filled for immediate analysis.Analysis Results
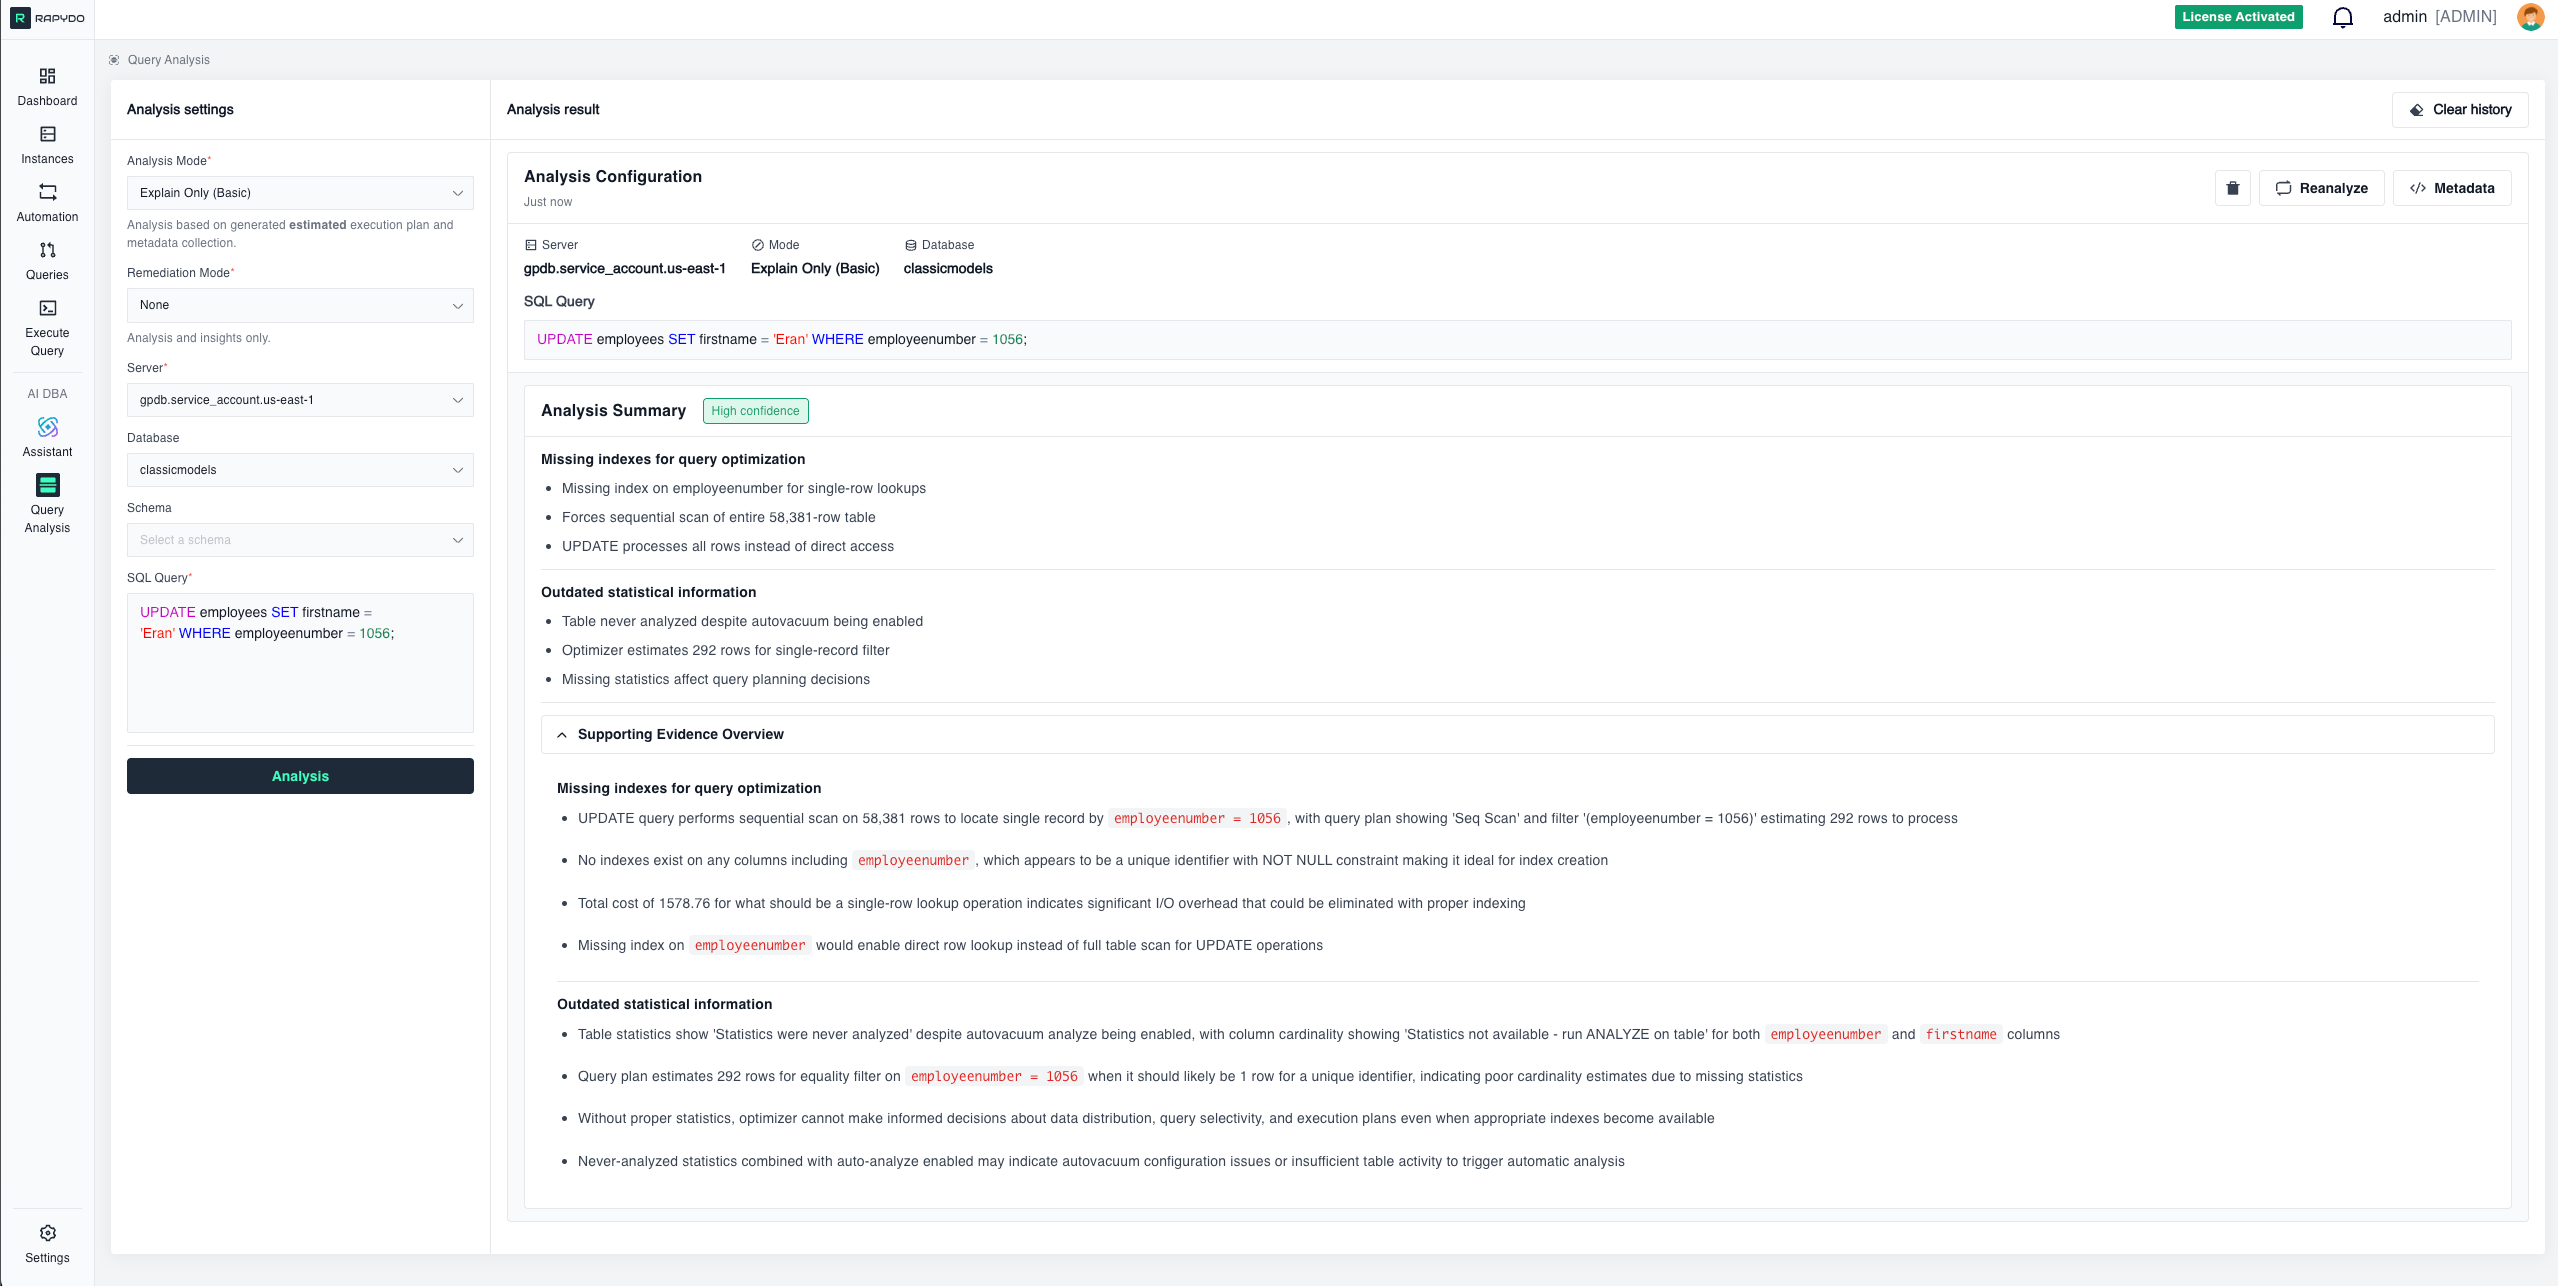
After clicking Analysis, the system connects to your database, generates an execution plan, collects metadata, and runs AI analysis. Results include:Analysis Configuration
A summary header showing:- Server name
- Analysis mode (Explain Only or Explain Analyze)
- Database name
- Timestamp
- The SQL query being analyzed (with syntax highlighting)
Analysis Summary
- Using
pg_sleep(4)creates deliberate 4-second delay per row - Function dominates performance regardless of other optimizations
- Affects every row processed during query execution
- No indexes on join columns
employeeNumberandcustomerNumber - Forces expensive nested loops processing billions of combinations
- Sequential scans required for all table access operations
- Processes large tables before applying selective payment filter
- Creates massive intermediate results exploding to billions of rows
- Should start with filtered payments then smallest tables
- Employees and payments tables never analyzed despite autovacuum enabled
- Optimizer uses default assumptions creating unrealistic row estimates
- Inconsistent statistics across tables affects join decisions
Remediation Plan
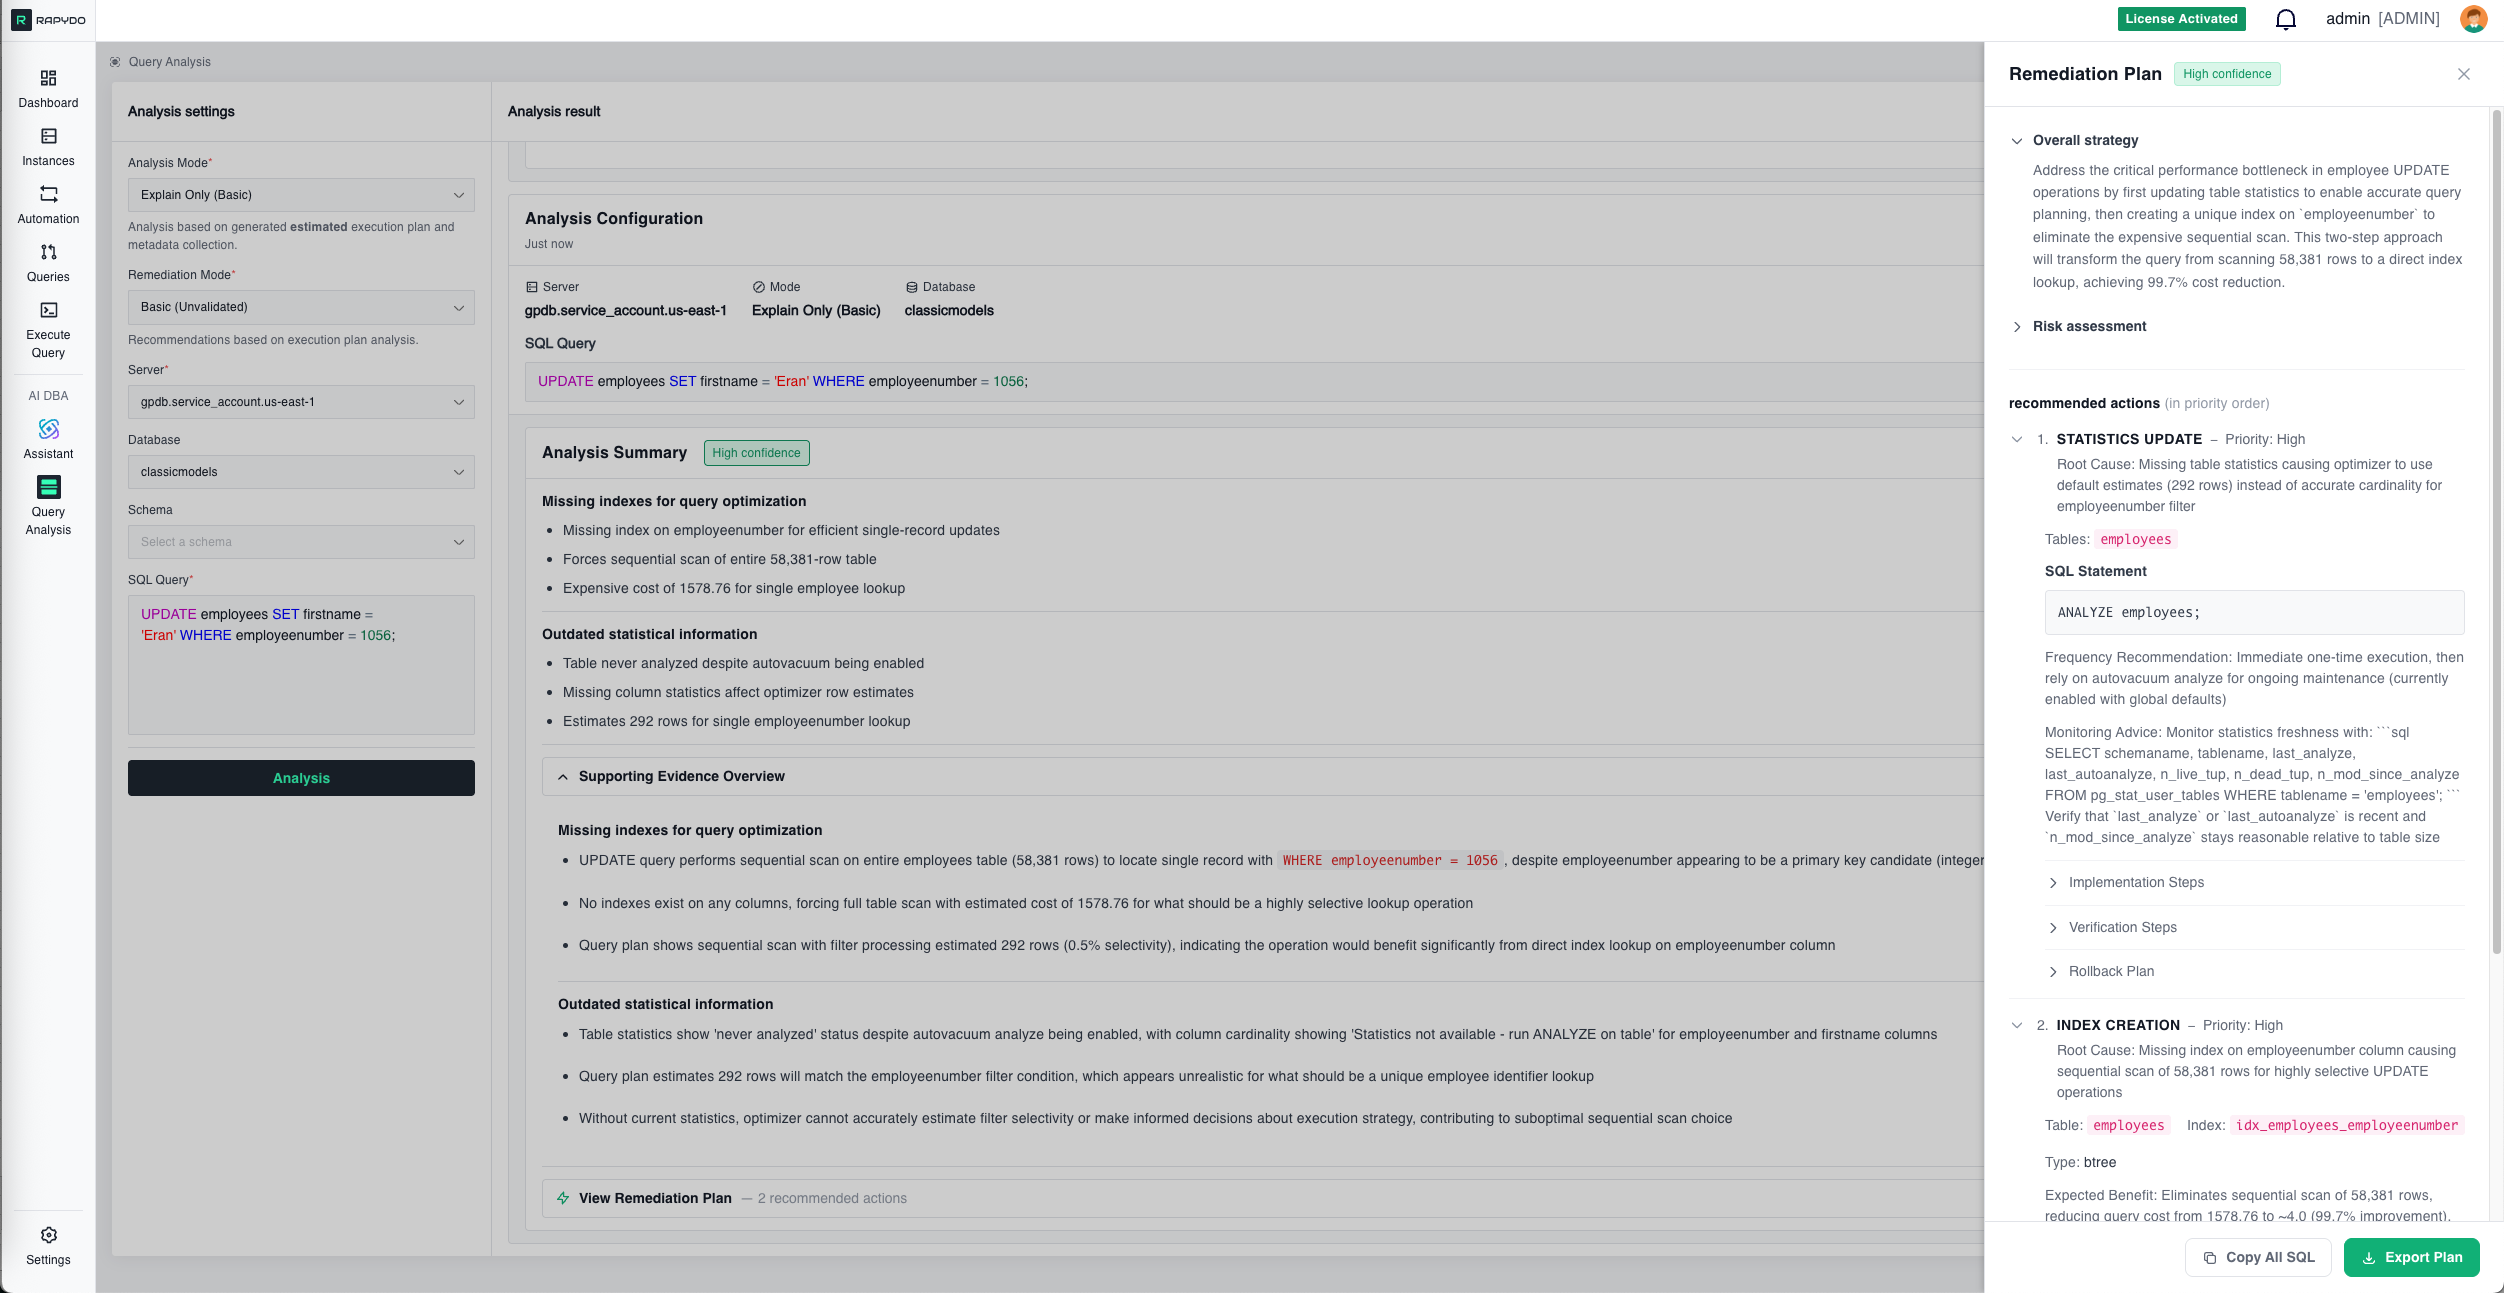
Specific Actions
Clear, prioritized steps to resolve the issue.Ready-to-Run SQL
Pre-written SQL statements you can execute immediately:Estimated Impact
Expected performance improvements after implementing the fix: Example:- Current performance: Query takes 88 seconds
- After index creation: Expected execution time ~2 seconds (98% improvement)
- After statistics update: Optimizer will choose more efficient join order
Implementation Guidance
Important considerations for safely applying the fix: Example:- Index creation will lock the table briefly (~10 seconds for 56K rows)
- Recommended to run during low-traffic periods
- Consider using
CREATE INDEX CONCURRENTLYon PostgreSQL for zero-downtime creation - Verify index usage with
EXPLAINafter creation
Priority & Order
When multiple issues exist, the plan indicates the order to address them: Example:- High Priority: Create index on
employeeNumber(biggest impact) - Medium Priority: Update table statistics (improves optimizer decisions)
- Low Priority: Consider query rewrite (minor optimization)
Supporting Evidence Overview
Detailed technical evidence backing each finding. This section shows exactly what the AI observed in the execution plan and metadata: Function Analysis:- “Query includes
pg_sleep(4)function call in SELECT clause, introducing deliberate 4-second delay per row processed”
- “Join condition
e.employeeNumber = c.salesRepEmployeeNumberforces nested loop with 56,078 × 249,856 row comparisons, creating 3.08 million intermediate results”
- “Query plan shows astronomical cost of 2.6 billion units due to nested loop joins processing 6.17 billion estimated row combinations”
- “Tables employees and payments show ‘Statistics were never analyzed’ despite having autovacuum analyze enabled”
- “Optimal approach should start with most selective filtered dataset—payments with 1,503 rows after WHERE amount < 1000”
Metadata Panel
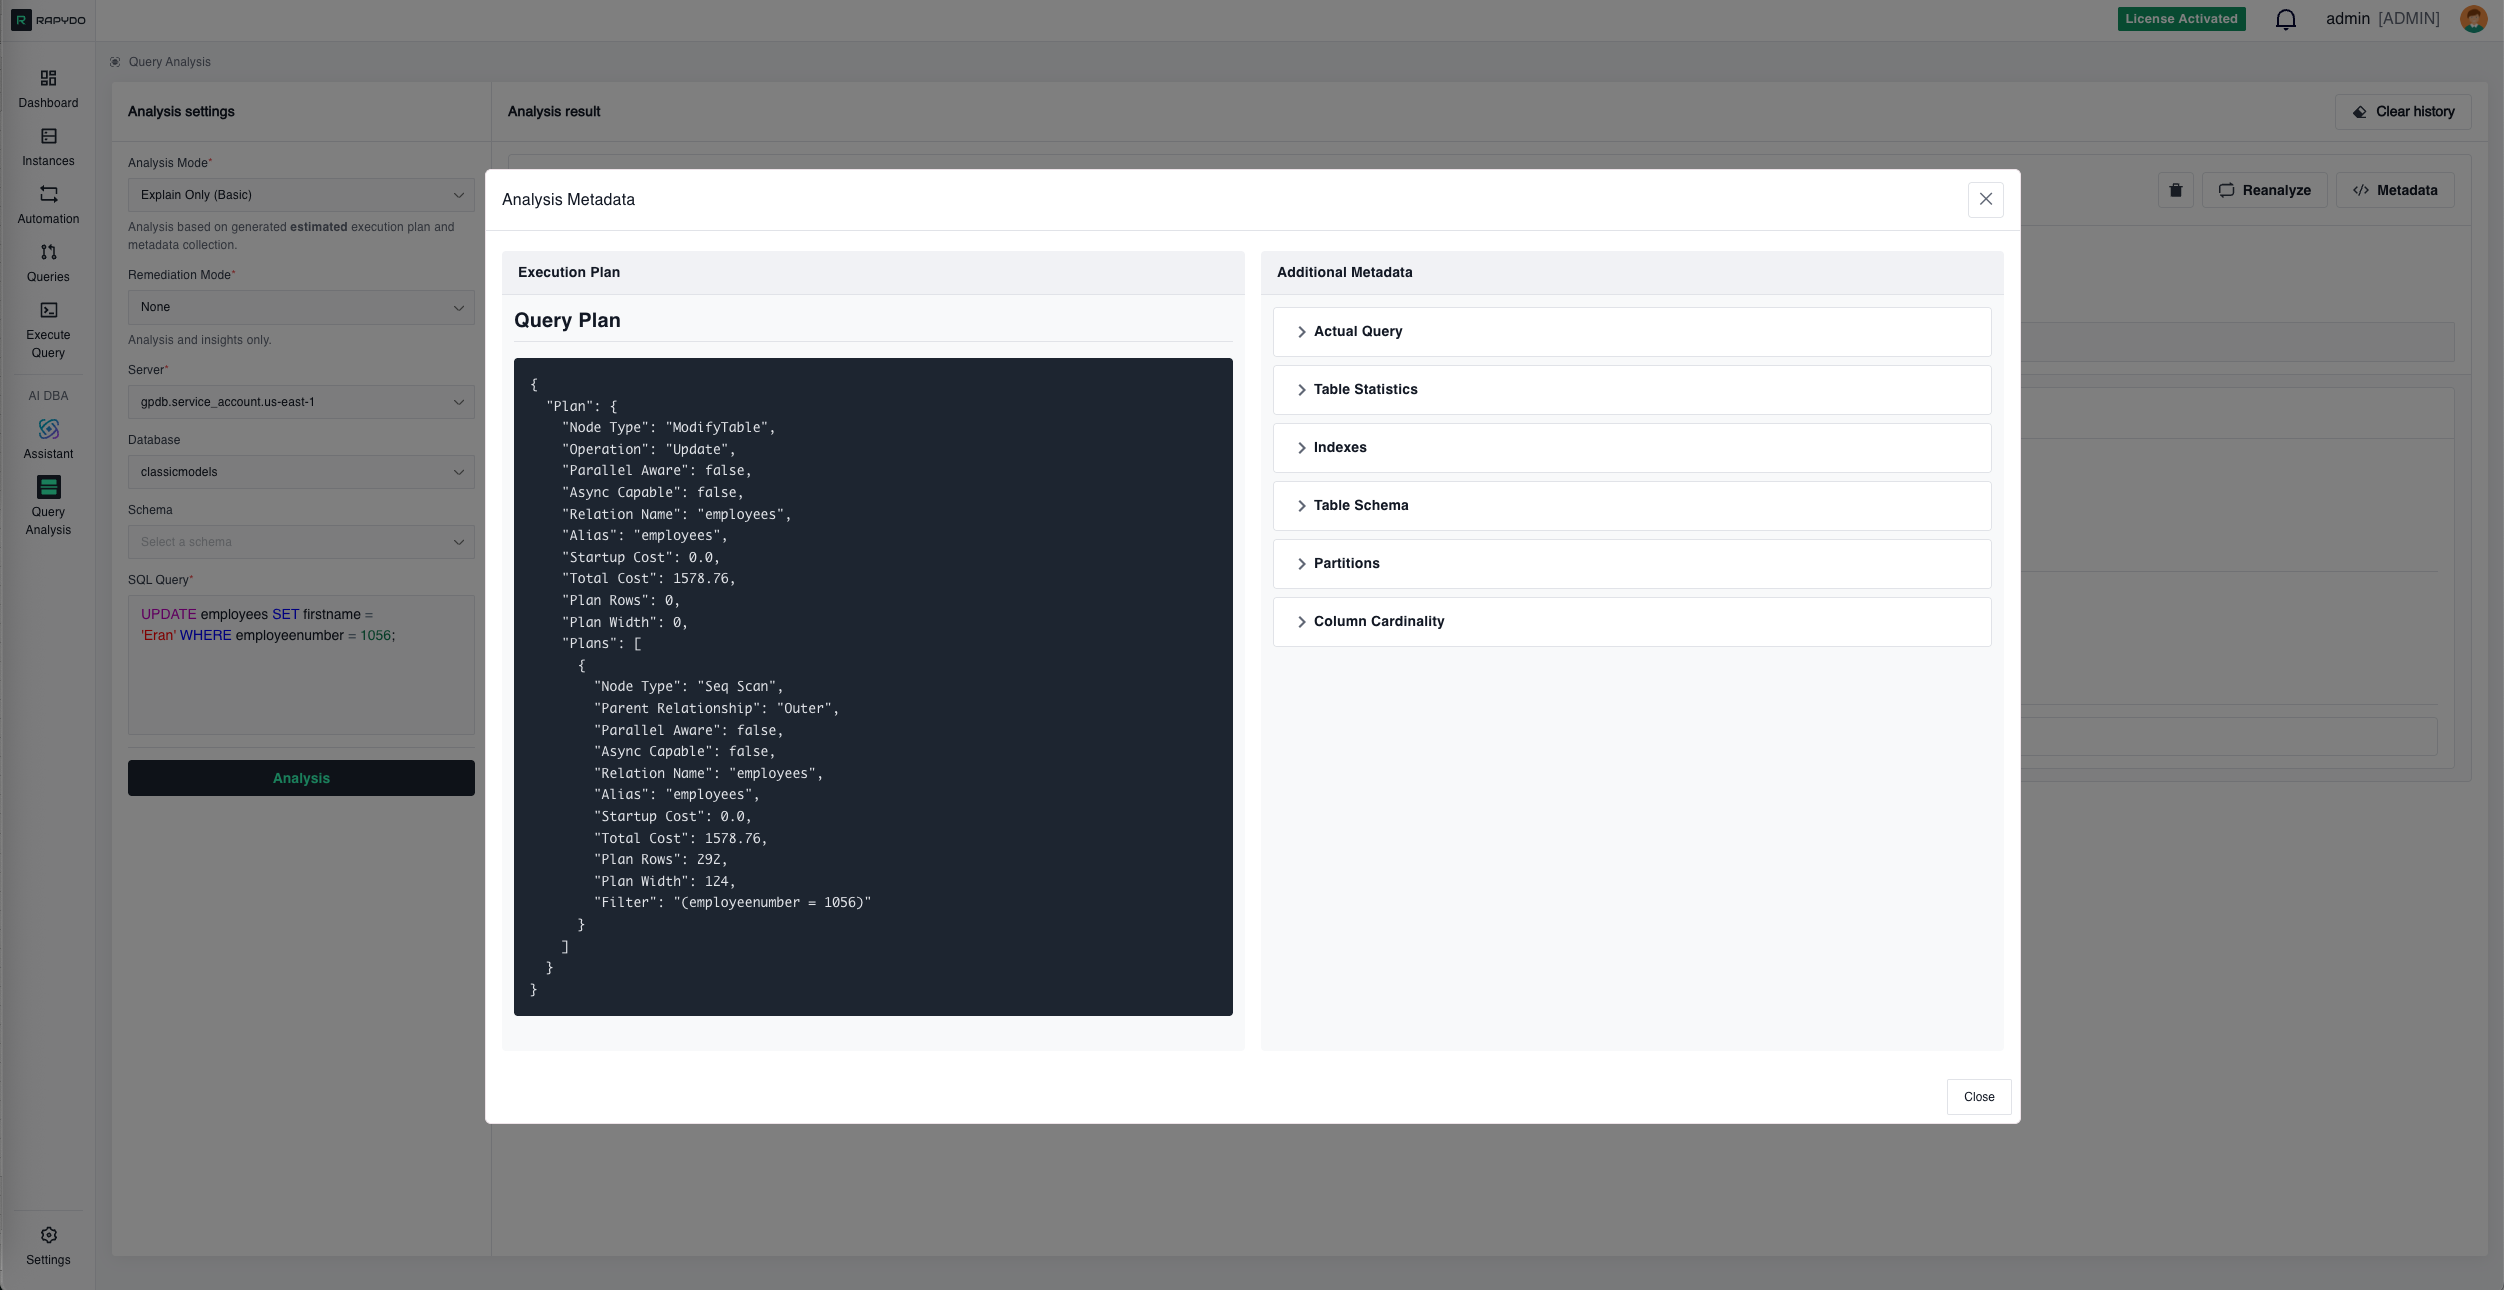
- Node types (Sequential Scan, Index Scan, Nested Loop, etc.)
- Cost estimates (startup cost, total cost)
- Row estimates vs. actual rows (when using Explain Analyze)
- Filter conditions and join predicates
Query Metadata Additional context including: Table Statistics:
- Row counts
- Last analyze timestamp
- Last vacuum timestamp
- Statistics age
- Existing indexes on affected tables
- Index definitions (columns, type, conditions)
- Or confirmation that no indexes exist
- Column definitions with data types
- Constraints (PRIMARY KEY, FOREIGN KEY, UNIQUE, NOT NULL)
- Default values
- Partition status for each table
- Partition strategy (RANGE, LIST, HASH)
- Partition boundaries
- Distinct value counts (n_distinct)
- Null percentages
- Average column width
- Correlation coefficient
- Histogram availability
Key Features
Confidence Ratings
Each analysis includes a confidence indicator (e.g., “High confidence”) showing how certain the AI is about its findings based on the available evidence. Confidence levels:- High: Strong evidence from execution plan and metadata
- Medium: Reasonable inference based on available data
- Low: Suggestion that requires verification
Multiple Analysis Perspectives
The AI examines queries from several angles simultaneously:- Execution efficiency — Scan types, join algorithms, row estimates
- Index utilization — Missing indexes, unused indexes, index suggestions
- Statistics freshness — Outdated statistics, missing statistics
- Schema design — Join patterns, data types, constraints
Actionable Output
Findings are presented as specific, actionable items rather than generic advice: ❌ Generic: “Consider adding an index” ✅ Specific: “Create index onemployees(employeeNumber) — Expected 98% performance improvement”
❌ Generic: “Query is slow”
✅ Specific: “Nested loop processing 3.08M row combinations due to missing index on join column”
Results Panel Controls
Each analysis result in the panel has the following controls:- Delete (trash icon) — Removes that specific analysis from the results panel
- Reanalyze — Opens the Reanalyze settings dialog, pre-filled with the original query and settings, to run a fresh analysis
- Metadata — Opens the raw metadata viewer (execution plan, table statistics, indexes, schema)
- Clear history (top of results panel) — Removes all analyses from the panel at once
Reanalyze
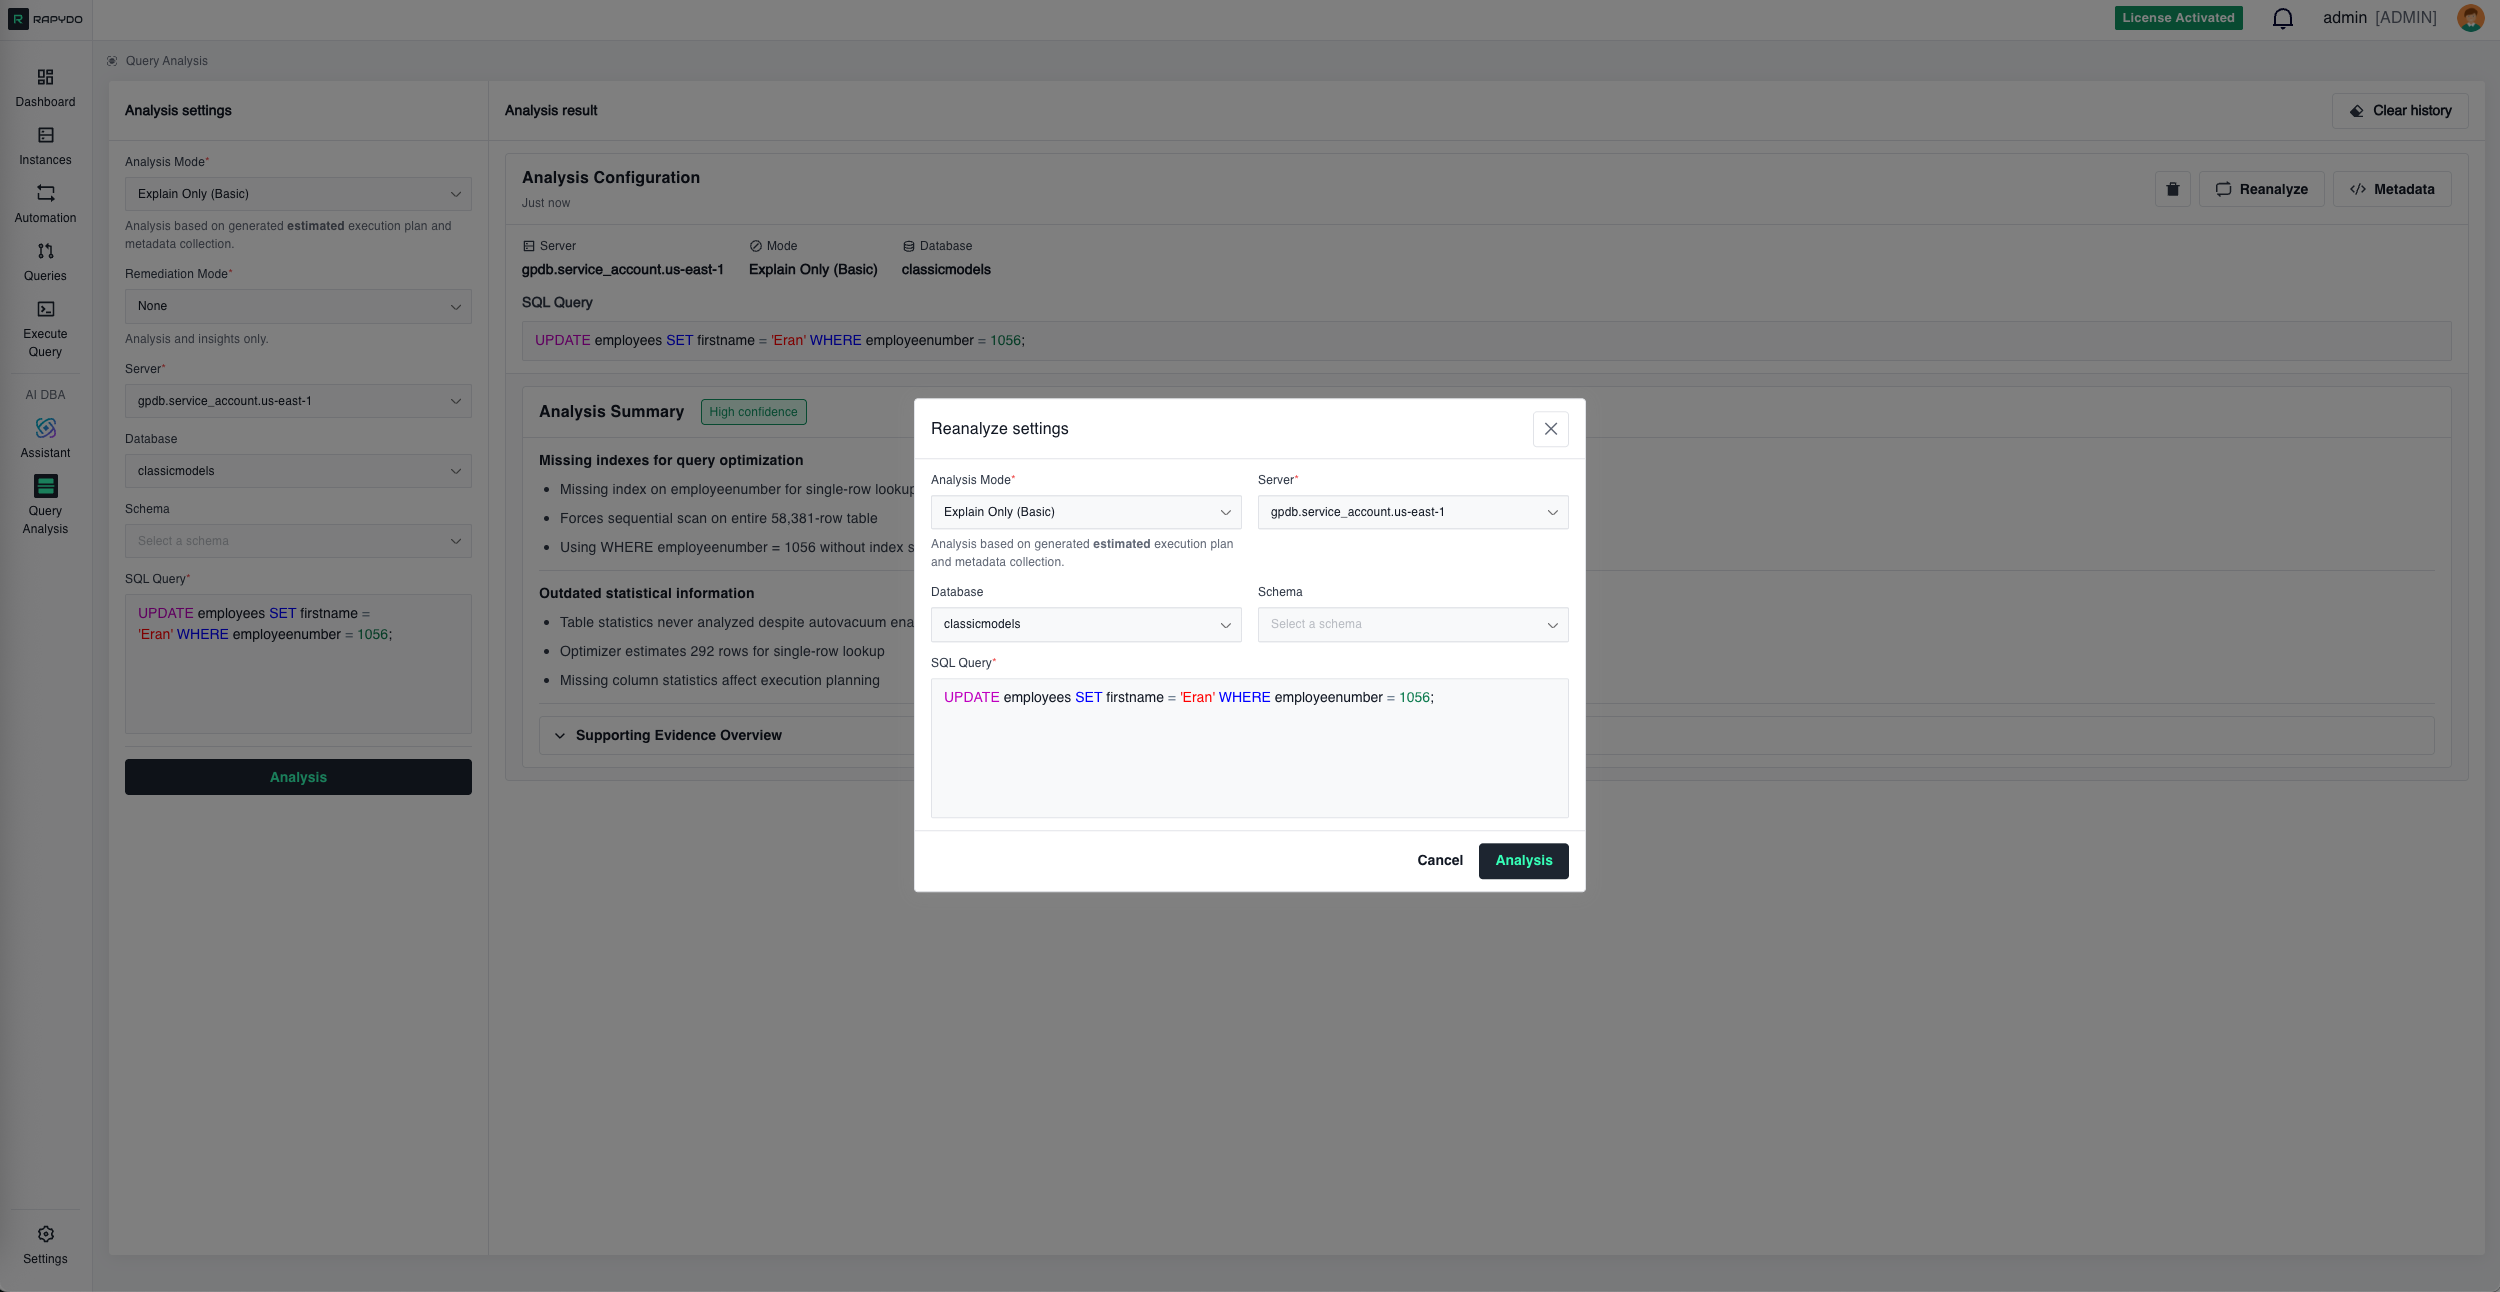
- ✅ New execution plan with improved costs
- ✅ Index usage confirmation
- ✅ Actual vs. estimated performance
- ✅ Remaining optimization opportunities
Example Workflow
Scenario: Dashboard shows an UPDATE query taking 88 seconds Step 1: Dashboard → Hover over the slow query → Click Analyze Query Step 2: Query Analysis opens with everything pre-filled (server, database, SQL) Step 3: Click Analysis Step 4: AI identifies:- Missing index on
employeeNumbercolumn - Outdated table statistics
- Sequential scan of 56,019 rows
Best Practices
Start with Problematic Queries
Focus on queries identified by:- AI DBA Assistant (“What’s causing high CPU?”)
- Dashboard insights (Longest Query widget)
- Query monitoring (Realtime view, Process History)
Use the Right Mode for Your Environment
Production databases:- ✅ Use Explain Only (Basic) — Safe, no query execution
- ❌ Avoid Explain Analyze (Advanced) — Actually runs the query
- ✅ Use Explain Analyze (Advanced) — Provides actual metrics
- Get real row counts instead of estimates
- Measure actual execution time
Review the Metadata
The execution plan and table statistics often reveal issues the summary might not emphasize:- Check row estimate accuracy (estimates vs. actual)
- Review filter selectivity
- Examine join algorithms chosen
- Verify statistics last update timestamps
Implement in Order
When multiple issues exist, follow the priority order in the Remediation Plan:- High priority fixes first (biggest impact)
- Medium priority after verifying high priority worked
- Low priority if needed
Reanalyze After Changes
Always verify that your optimizations had the intended effect:- ✅ Execution plan changed as expected
- ✅ Cost decreased significantly
- ✅ Index is being used
- ✅ No new issues introduced
Consider the Environment
Before implementing recommendations:- Index creation: May lock tables briefly, plan for low-traffic periods
- Statistics update: Safe anytime but consider impact on running queries
- Query rewrites: Test thoroughly in staging before production
- Schema changes: Coordinate with application deployments
Common Issues Detected
Missing Indexes
Symptom: Sequential scans on large tables, high query cost Remediation: Create indexes on frequently filtered or joined columns Expected Impact: 80-99% reduction in query time for index-eligible queriesOutdated Statistics
Symptom: Optimizer choosing wrong join order, inaccurate row estimates Remediation: RunANALYZE on affected tables
Expected Impact: Better query plans, 30-70% performance improvement
Inefficient Join Order
Symptom: Processing large tables before applying filters Remediation: Rewrite query or update statistics to help optimizer Expected Impact: Fewer intermediate rows, 40-80% improvementFull Table Scans
Symptom: Reading entire table when only few rows needed Remediation: Add WHERE clause filters, create appropriate indexes Expected Impact: Read only necessary rows, 70-95% I/O reductionN+1 Query Pattern
Symptom: Many small queries instead of one join Remediation: Rewrite as single JOIN query Expected Impact: Eliminate round trips, 90%+ improvementIntegration with Other Features
From AI DBA Assistant
Assistant-identified slow queries link directly to Query Analysis for deep investigation.To Execute Query
From Query Analysis, click action buttons to open the Execute Query tool with remediation SQL pre-loaded.From Dashboard
Dashboard widgets (Longest Query, Query Avg Time) provide direct access to Query Analysis.To Automation
Create Scout Rules based on Query Analysis findings to automatically detect similar issues in the future.What’s Next?
- AI DBA Assistant - Ask questions about your database fleet in natural language
- Execute Query - Run SQL queries and remediation commands
- Queries - Monitor real-time query activity