Overview
Getting Started
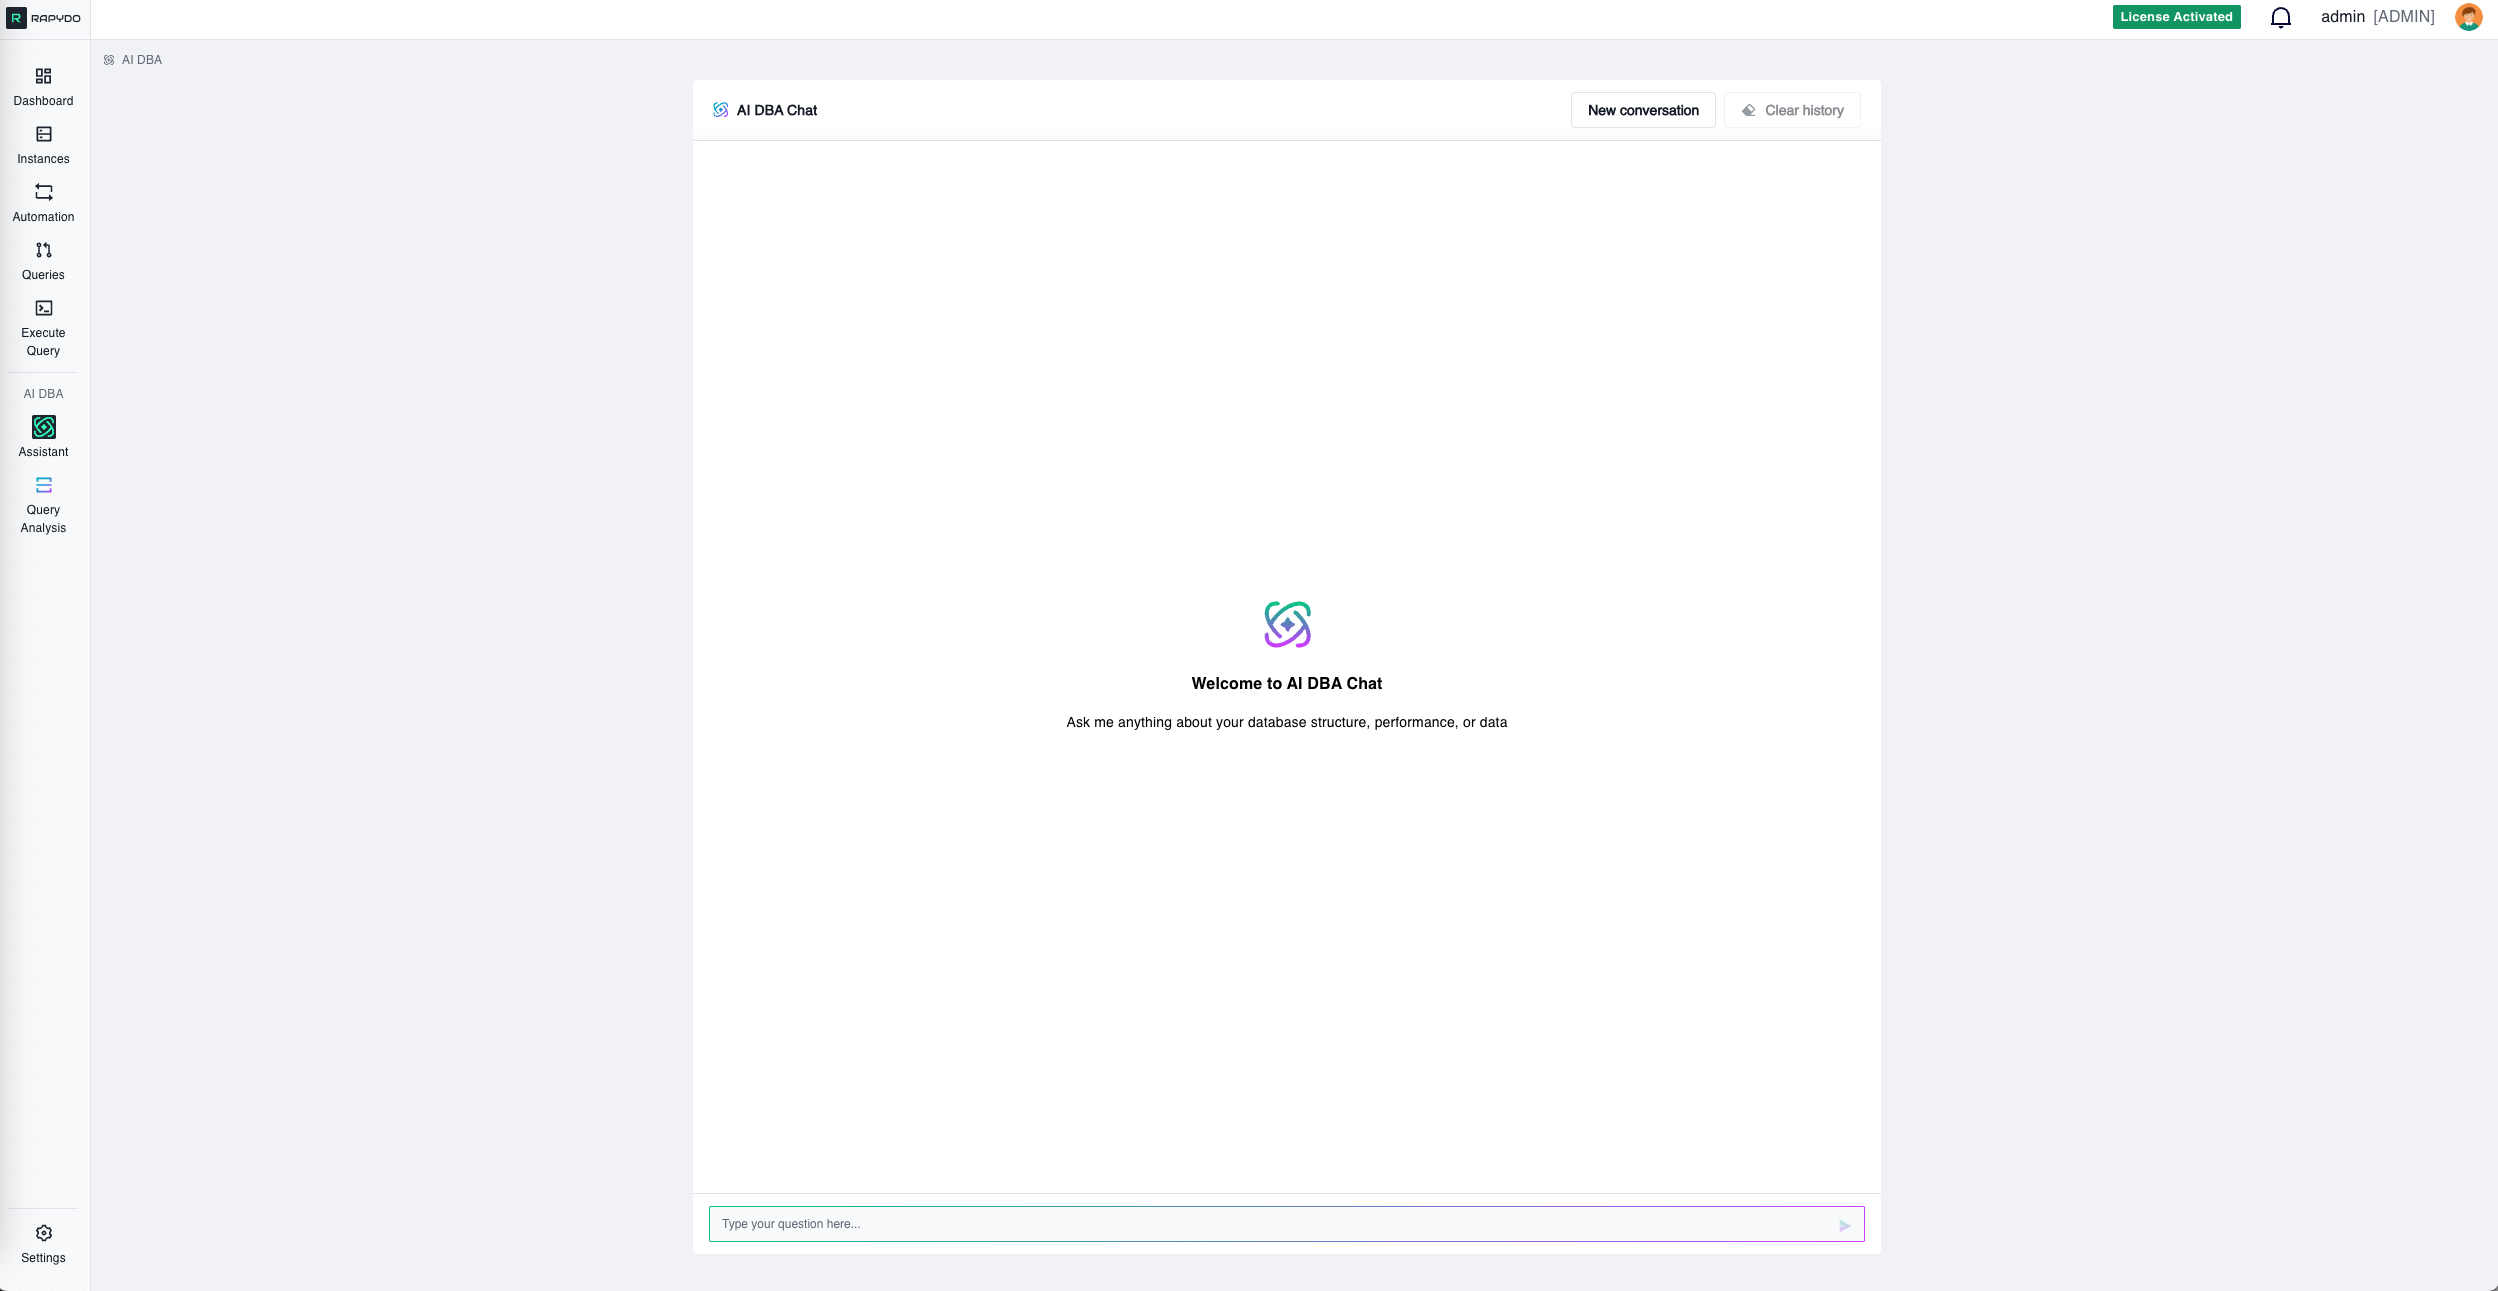
Access the Assistant from the left navigation panel under AI DBA → Assistant. The interface is straightforward: type your question in the input field and press enter or click the send button. Conversation Controls:- New conversation — Starts a fresh conversation, clearing the current context
- Clear history — Removes all messages from the current view (disabled when no messages exist)
“Show me the top 3 longest queries from the last day”
Key Features
Natural Language Queries
Ask questions the way you would ask a senior DBA. The AI understands context and database terminology across both MySQL and PostgreSQL environments. What you can ask:- “Are there any performance issues in my databases over the last 24 hours?”
- “How many locks do we have today on the fleet?”
- “Which instances have the highest connection count right now?”
- “Show me slow queries affecting the payments table”
- “What’s causing high CPU on our production database?”
- “Analyze the queries running longer than 5 minutes”
- “Why is this query slow: SELECT * FROM orders WHERE created_at > ‘2024-01-01‘“
Rich Analysis Results
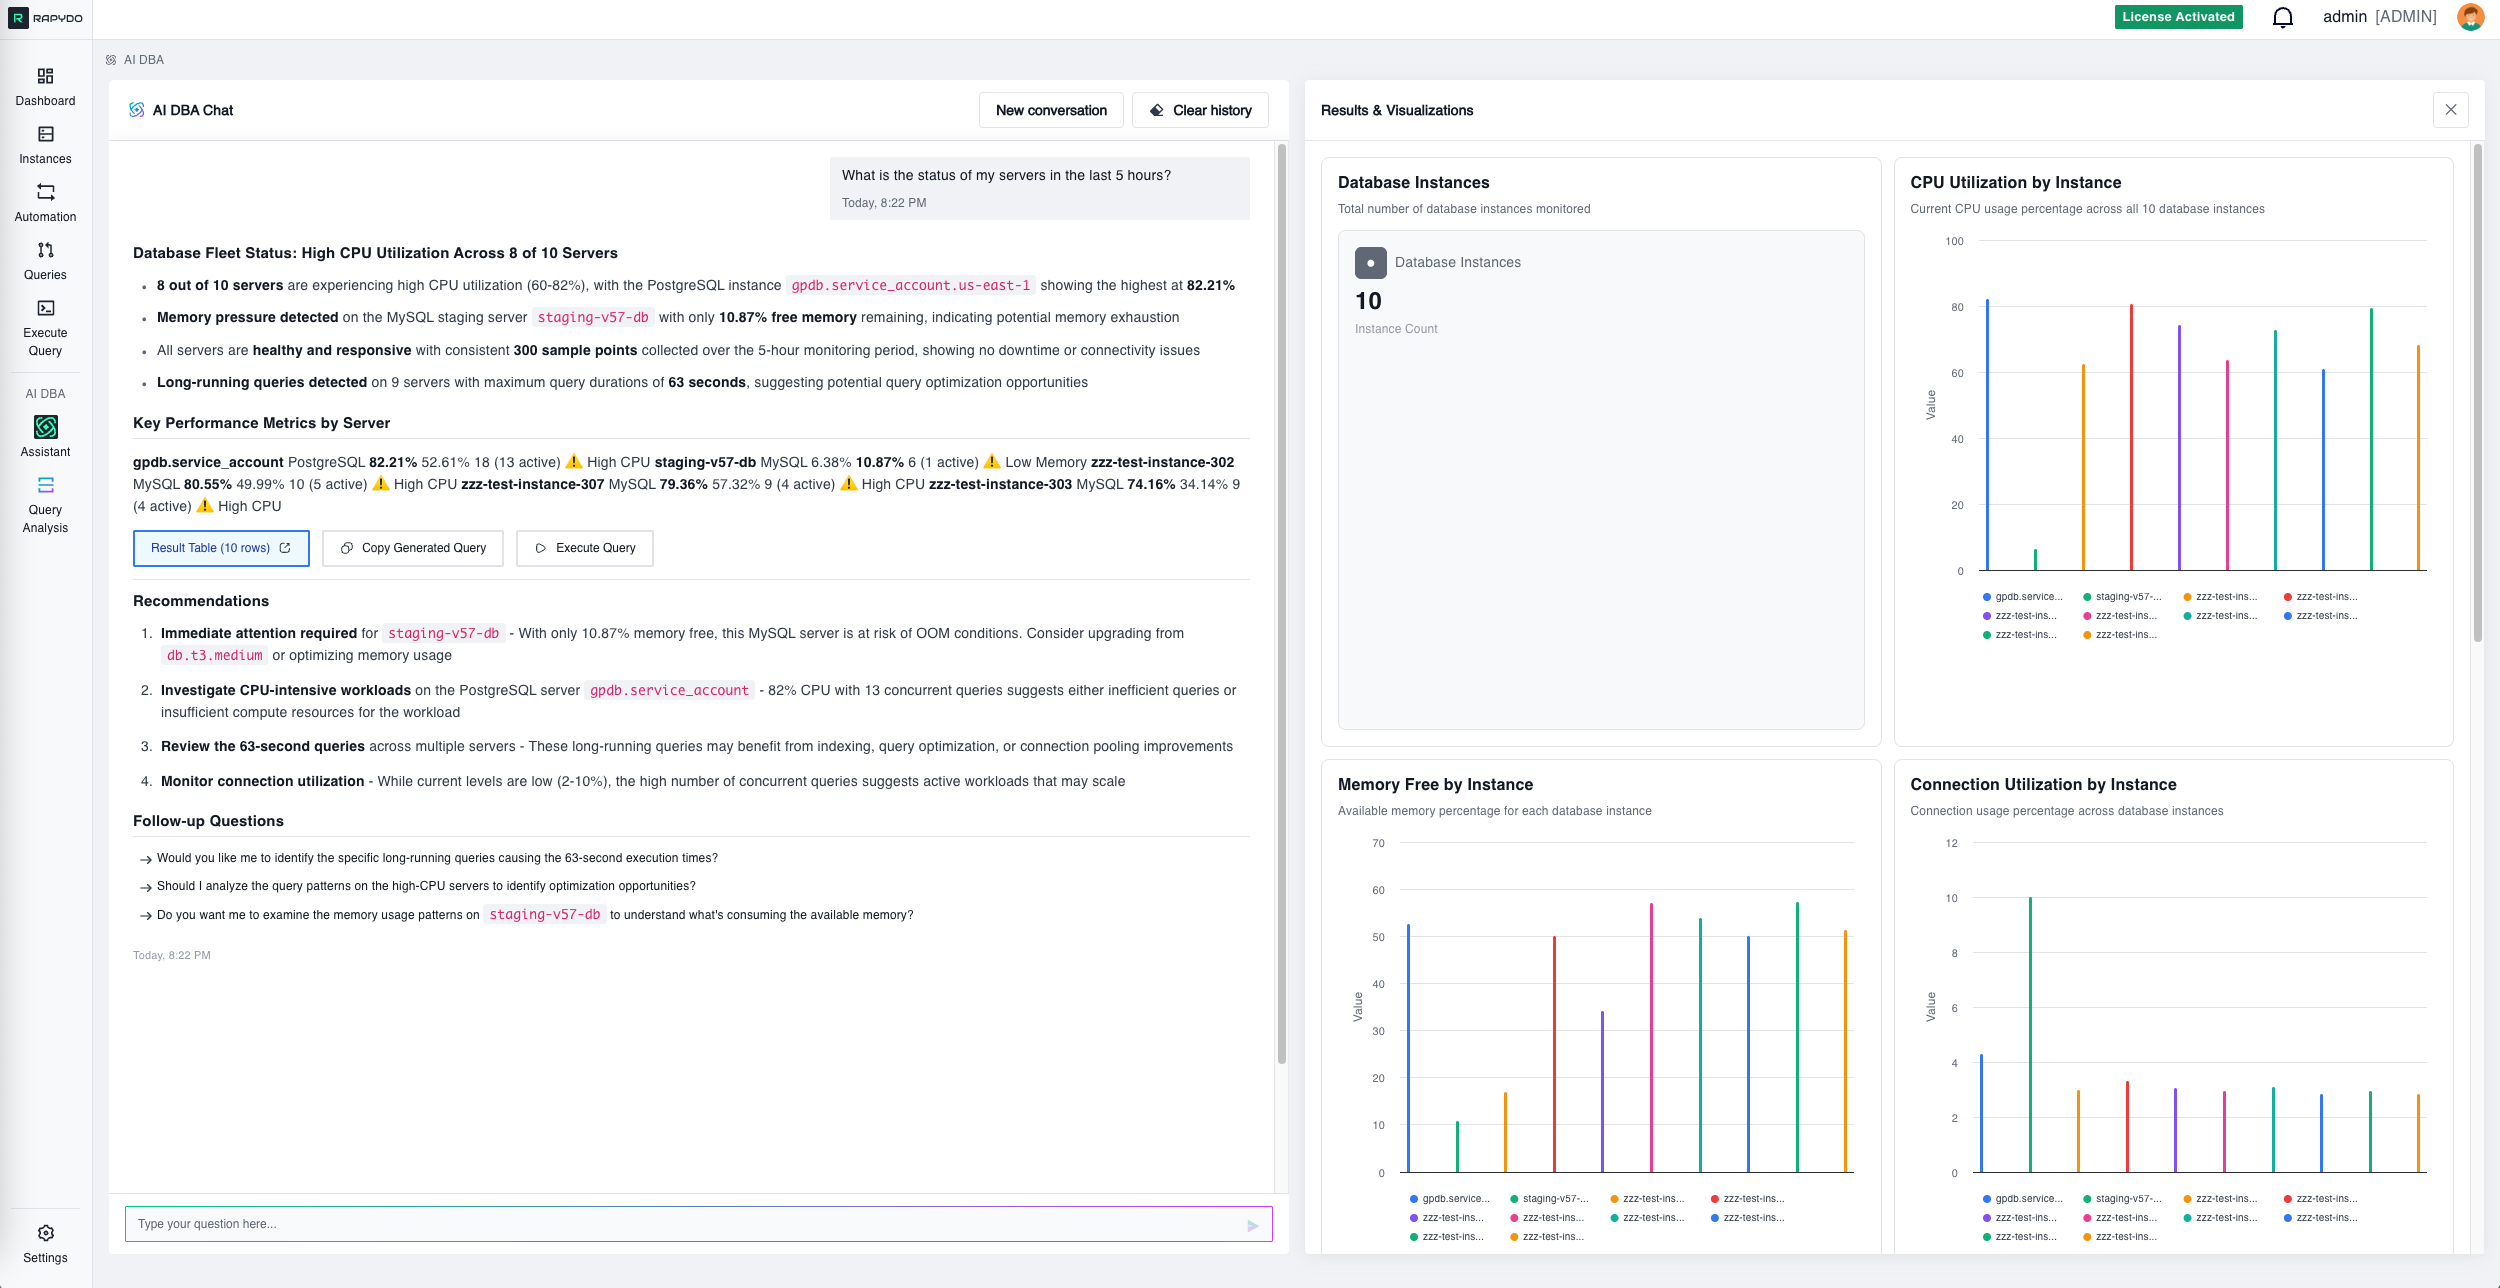
Every response includes multiple components designed to give you complete context:Findings Summary
A clear statement of what the AI discovered, including:- Affected database instances
- Timeframes and frequency
- Severity indicators
- Impact on performance
The Query
When relevant, the AI displays the actual SQL being analyzed, formatted for readability. This includes:- Full query text with syntax highlighting
- Execution time and resource usage
- Database and user information
Query Analysis
The AI doesn’t just show you what’s slow—it explains why and how to fix it: Root Cause Identification:- Missing indexes
- Inefficient joins or subqueries
- Full table scans
- Locking or blocking issues
- Resource constraints (CPU, memory, I/O)
- Specific actions to implement
- Ready-to-run SQL for creating indexes or modifying queries
- Estimated performance impact (e.g., “Expected 80% reduction in execution time”)
- Implementation guidance with considerations and best practices
Recommendations
Prioritized action items beyond the immediate query fix:- Related optimizations for similar queries
- Schema design improvements
- Configuration adjustments
- Monitoring suggestions
Follow-up Questions
Suggested next steps to continue your investigation. Click any suggestion to drill deeper into the issue. Examples:- “Show me all queries using the orders table”
- “What other indexes might help this workload?”
- “Are there any blocking queries right now?”
Results & Visualizations Panel
Data Tables
Searchable result sets showing:- Query details and full SQL text
- Execution metrics (duration, CPU, rows examined)
- User information and connection details
- Query state and status
Charts & Graphs
Visual representations of fleet-wide metrics:- Lock counts by database instance
- Average wait times across the fleet
- Distribution breakdowns (lock types, query types, etc.)
- Time-series trends (CPU, connections, query duration)
Quick Stats
At-a-glance metrics:- Total fleet locks
- Instance counts
- Aggregate values (total queries, average duration, etc.)
Action Buttons
Each analysis includes action buttons to move from insight to resolution: Result Table View the raw data behind the analysis in a sortable, filterable table format. Copy Generated Query Get the SQL that Assistant used internally, ready to paste into your own tools or save for future reference. Execute Query Opens Rapydo’s Execute Query tool with the generated SQL pre-loaded. From there you can:- Review and modify the query
- Run it against RapydoDB for further investigation
- Save it as a template for future use
- Share it with your team
Best Practices
Be Specific About Timeframes
“Last 24 hours” or “since yesterday” helps Assistant focus on relevant data. Examples:- ❌ “Show me slow queries” (too vague)
- ✅ “Show me queries running longer than 10 seconds in the last 6 hours”
Name Your Instances
If you’re investigating a specific server, include its identifier in your question. Examples:- ❌ “Why is the database slow?”
- ✅ “Why is production-db-01 experiencing high CPU?”
Include Full Context
Since each question is independent, provide all necessary details in a single message rather than relying on follow-ups. Examples:- ❌ “What about yesterday?” (no context from previous question)
- ✅ “Show me CPU usage on production-db-01 yesterday between 2pm and 4pm”
Ask for Analysis When Needed
If you want recommendations and remediation plans, explicitly ask for analysis. Examples:- “Analyze this query and suggest optimizations: SELECT * FROM…”
- “What’s causing slow performance on database X and how can I fix it?”
How It Works
Assistant uses two data sources depending on the type of question asked:- RapydoDB — Rapydo’s dedicated monitoring database, queried for performance metrics, process history, slow queries, CPU/memory trends, locks, and fleet-wide activity data.
- Your database instances — Queried directly for schema information and data retrieval intents (e.g., listing tables, retrieving schema details).
Fast Responses
Performance and monitoring data is already aggregated in RapydoDB, so those queries return quickly regardless of your fleet size.Historical Analysis
All monitoring data is retained in RapydoDB, enabling you to investigate past incidents and identify long-term trends. 💡 Important: The Assistant cannot modify your production databases or execute DML/DDL commands. It is read-only in all cases.Supported Databases
Assistant analyzes monitoring data from all database engines supported by Rapydo:- MySQL (all versions)
- PostgreSQL (all versions)
Common Use Cases
Performance Investigation
“Show me queries running longer than 30 seconds on production-db-01 in the last hour” → Get full analysis with root causes and remediation plansFleet-Wide Monitoring
“Which instances have the highest CPU usage right now?” → View visual charts ranking your instances by resource usageLock and Blocking Analysis
“Are there any blocking queries affecting the orders table?” → Identify lock chains and get recommendations to resolve contentionQuery Optimization
“Analyze this query: SELECT * FROM users WHERE email = ‘test@example.com’” → Receive index recommendations and query rewrite suggestionsCapacity Planning
“Show me connection count trends across all instances for the last 7 days” → Visual time-series data to identify growth patternsTips for Better Results
✅ Use specific table or database names when investigating schema-specific issues ✅ Include query text when asking for optimization help ✅ Specify instance names when troubleshooting specific servers ✅ Combine multiple conditions for precise results: “Queries longer than 10s on production AND using the payments table”What’s Next?
- Query Analysis - Learn about Rapydo’s comprehensive query analysis and remediation features
- Execute Query - Explore the SQL editor for running custom queries against RapydoDB
- Queries - Understand real-time query monitoring