Queries View
DB Instance Selector
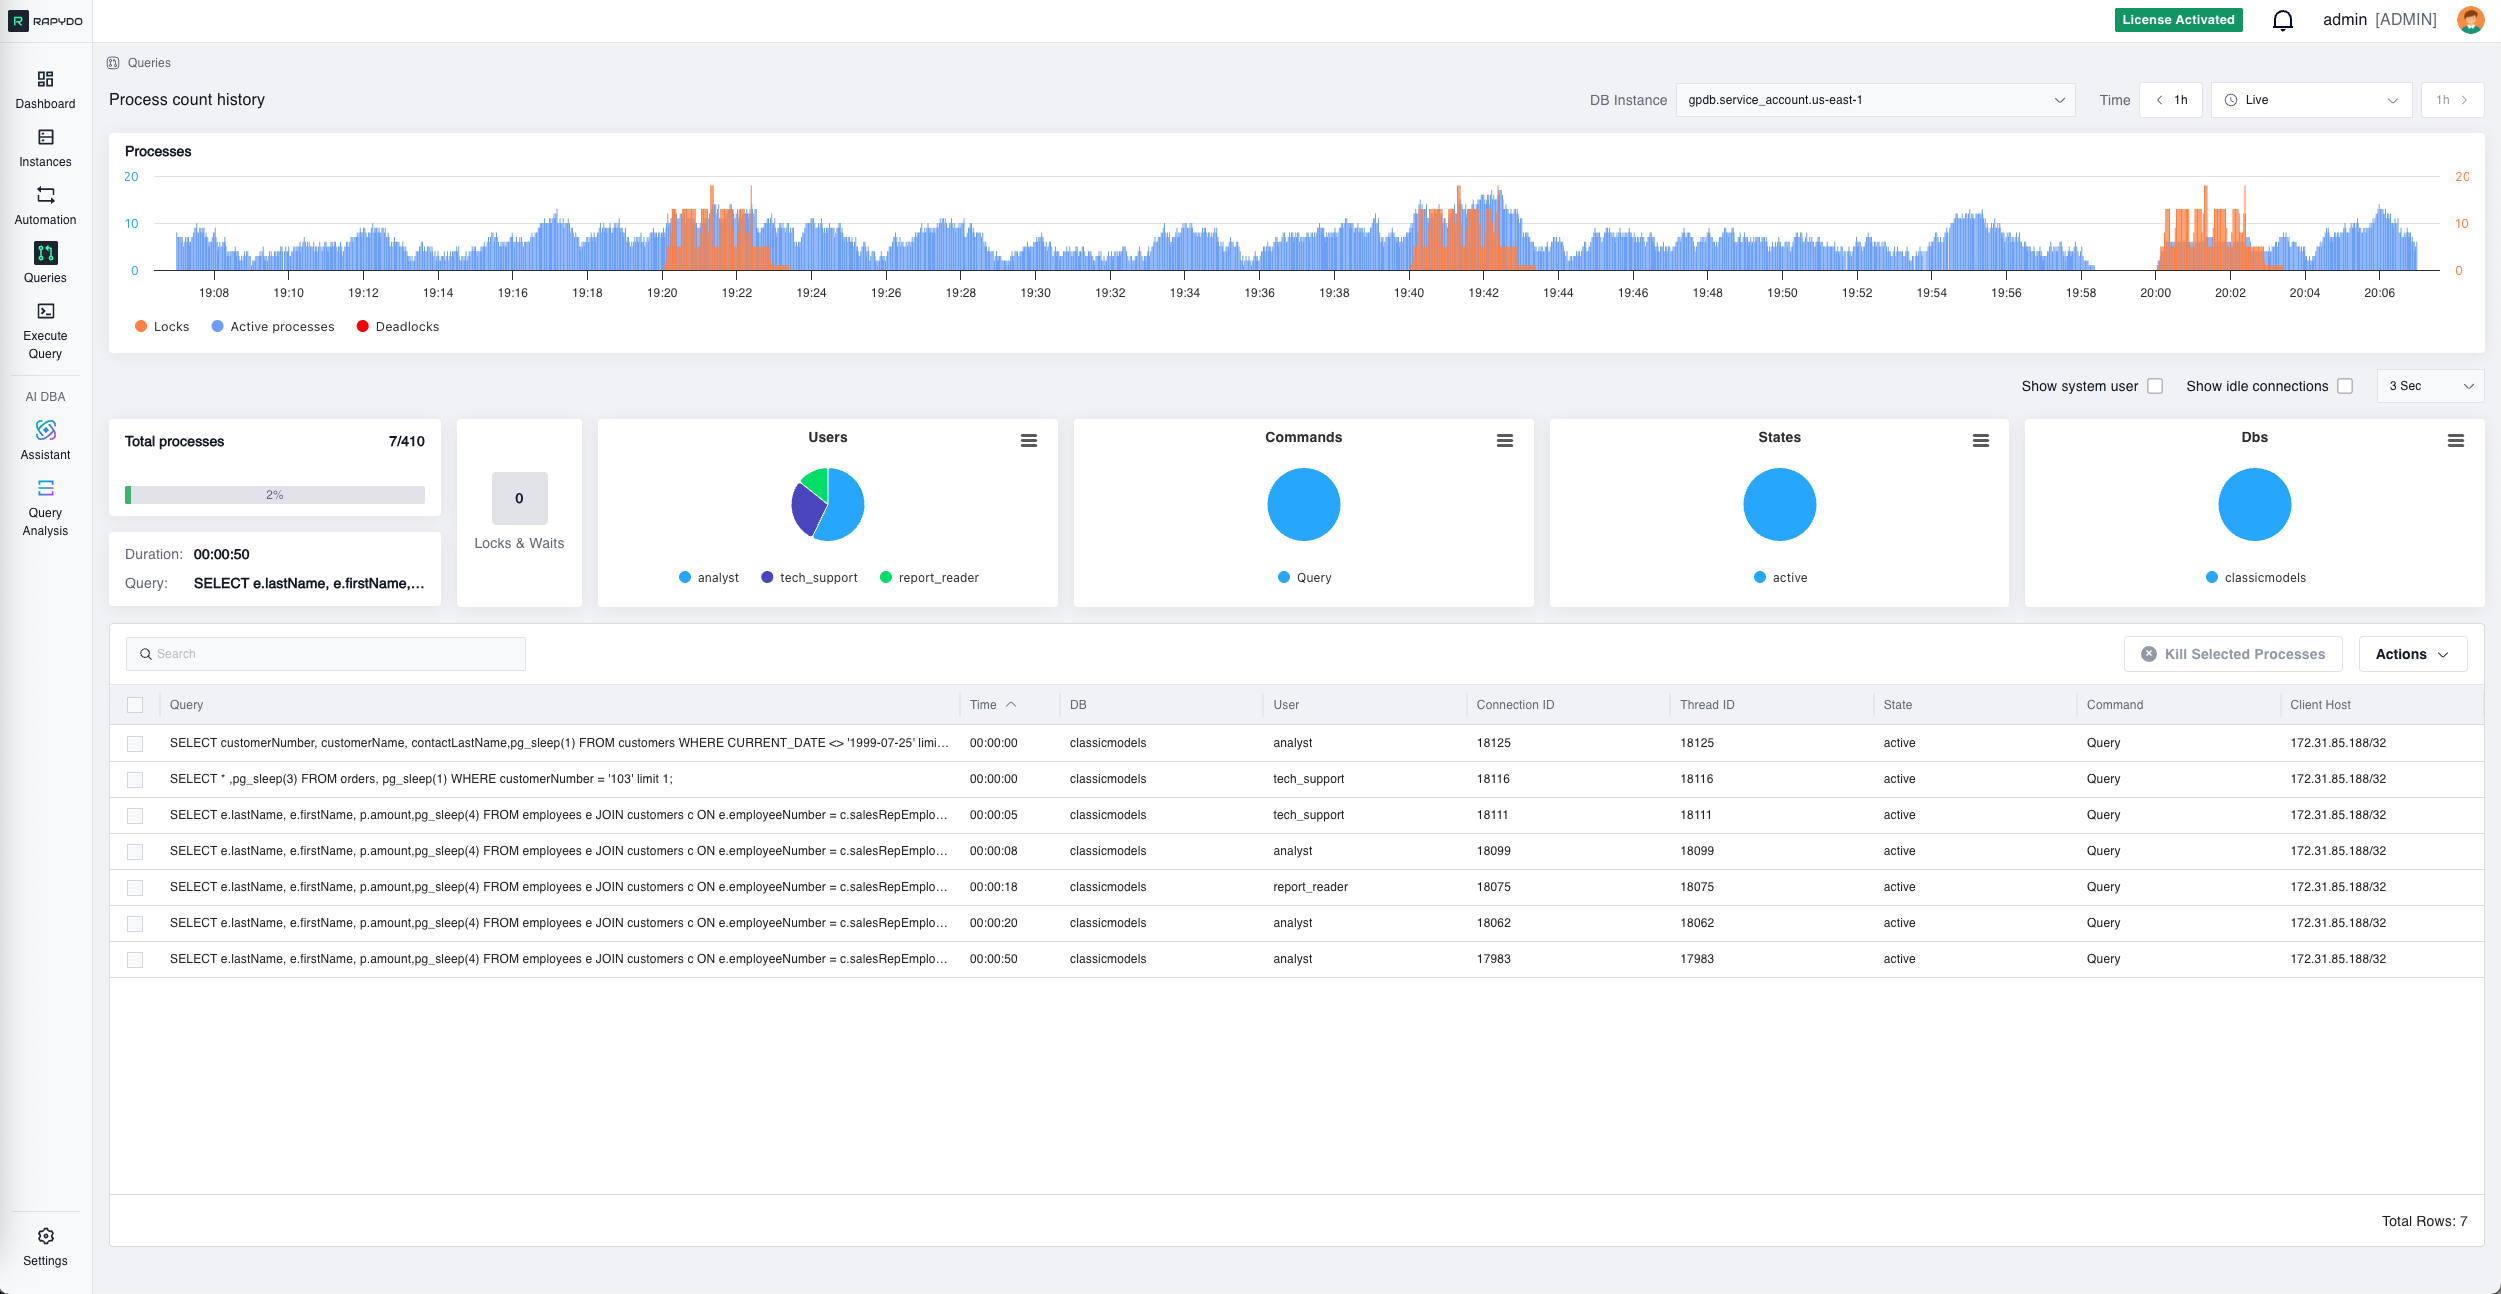
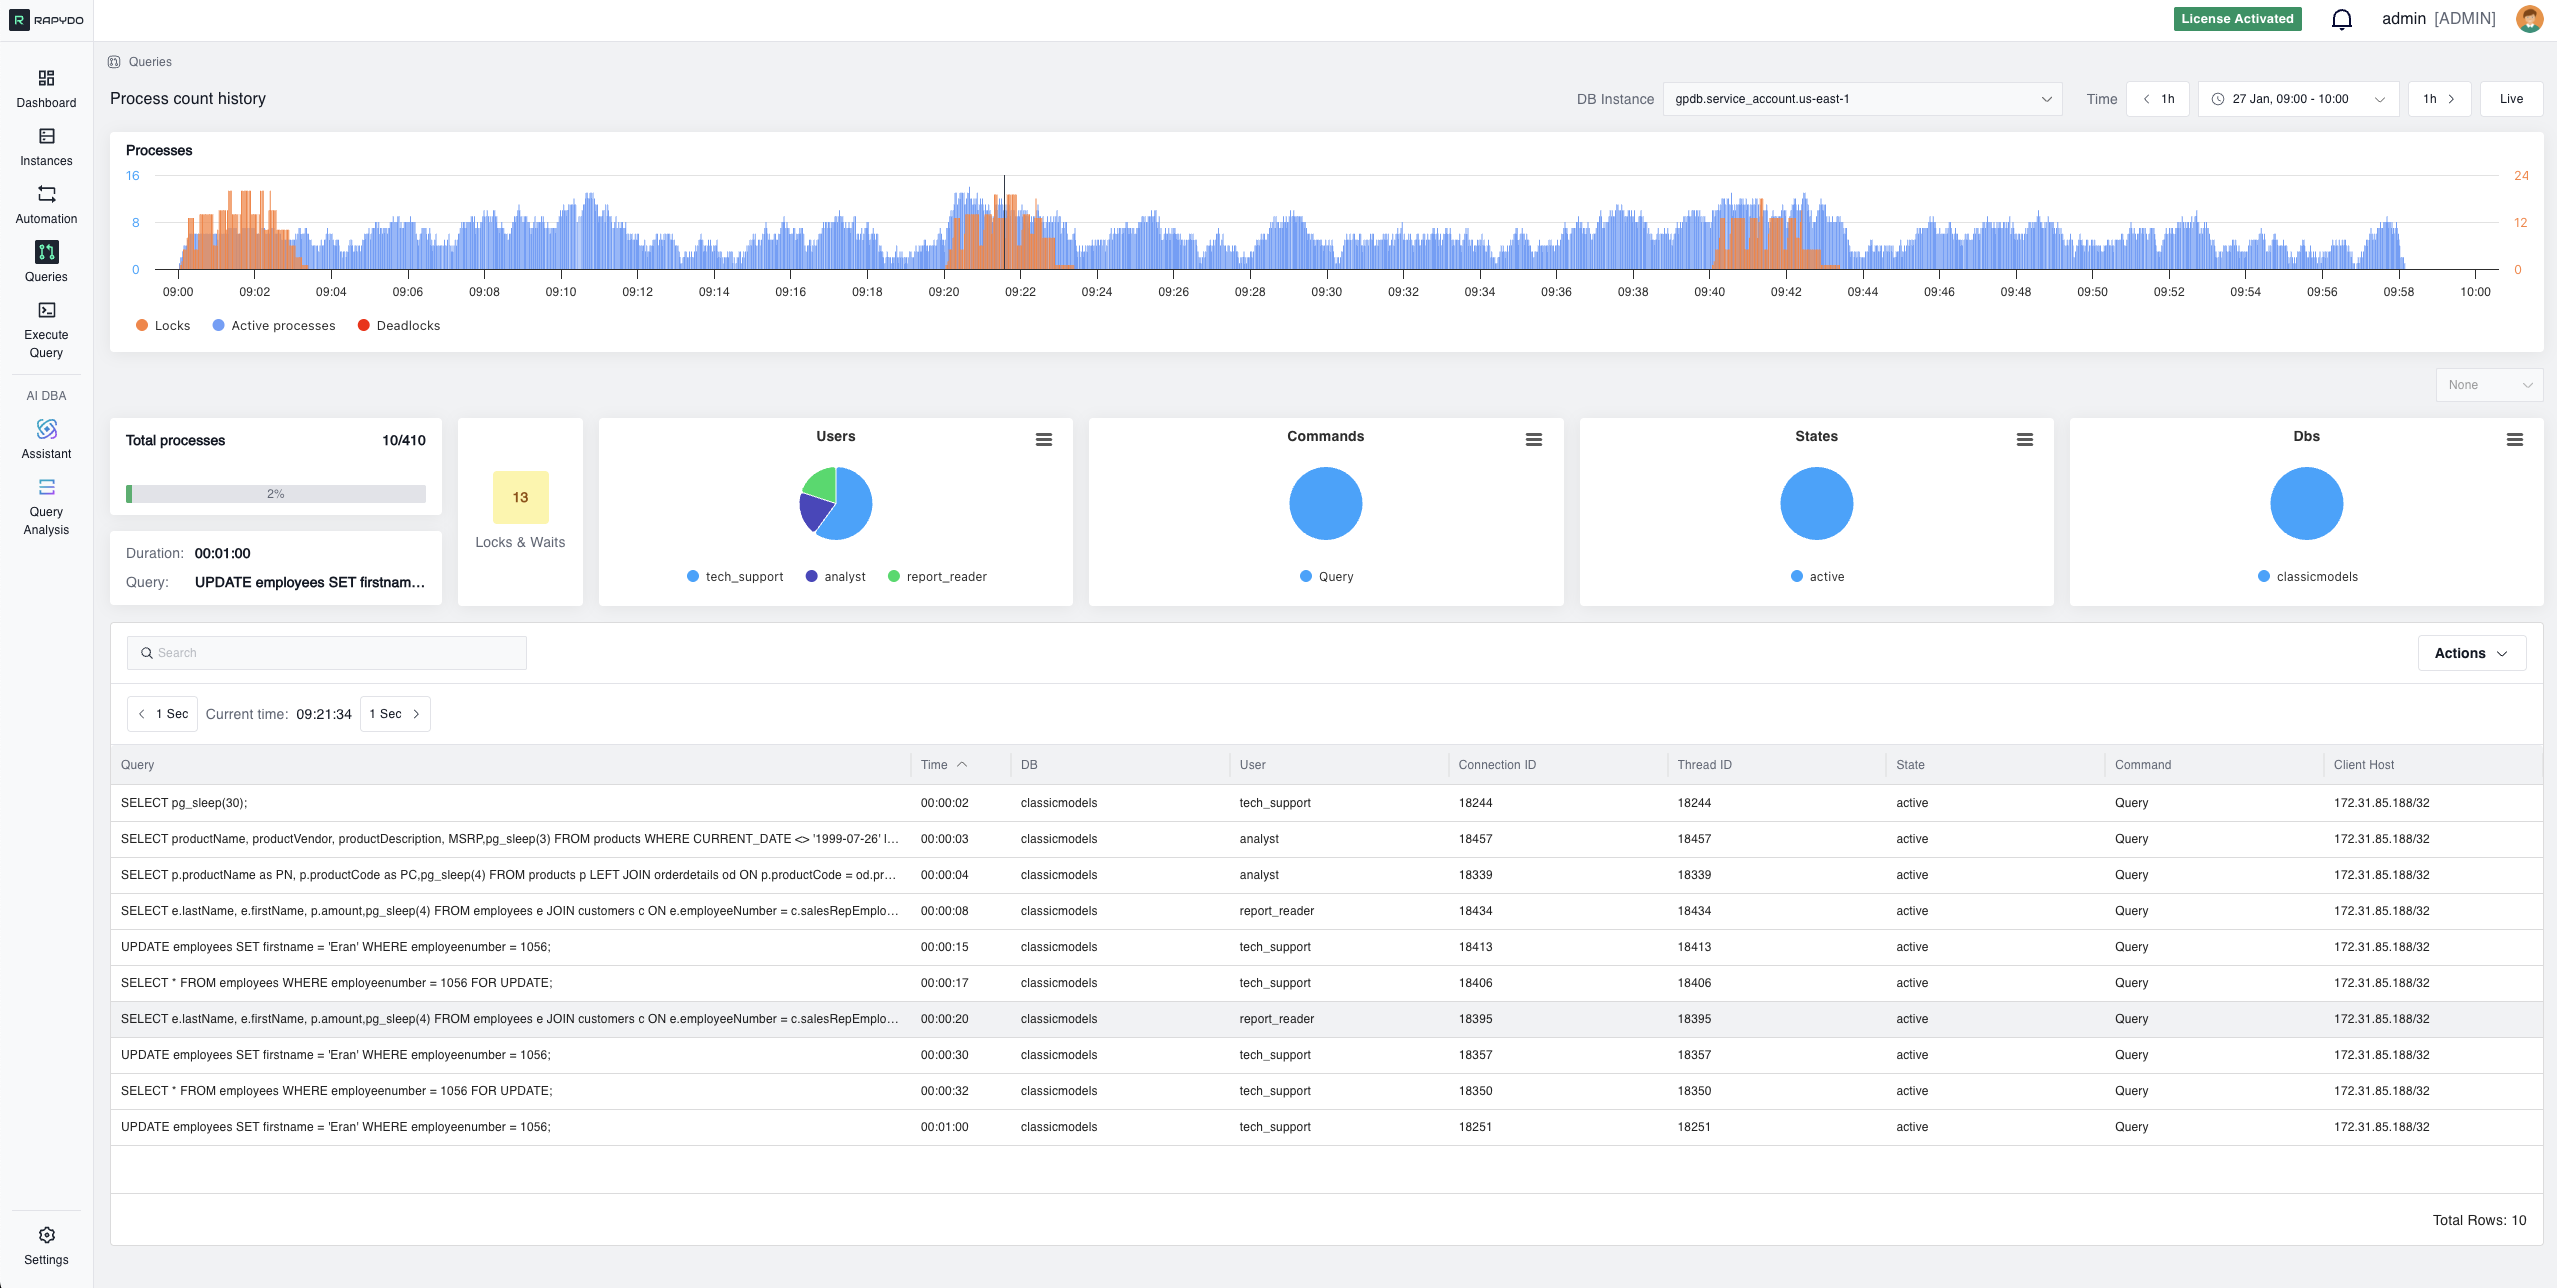
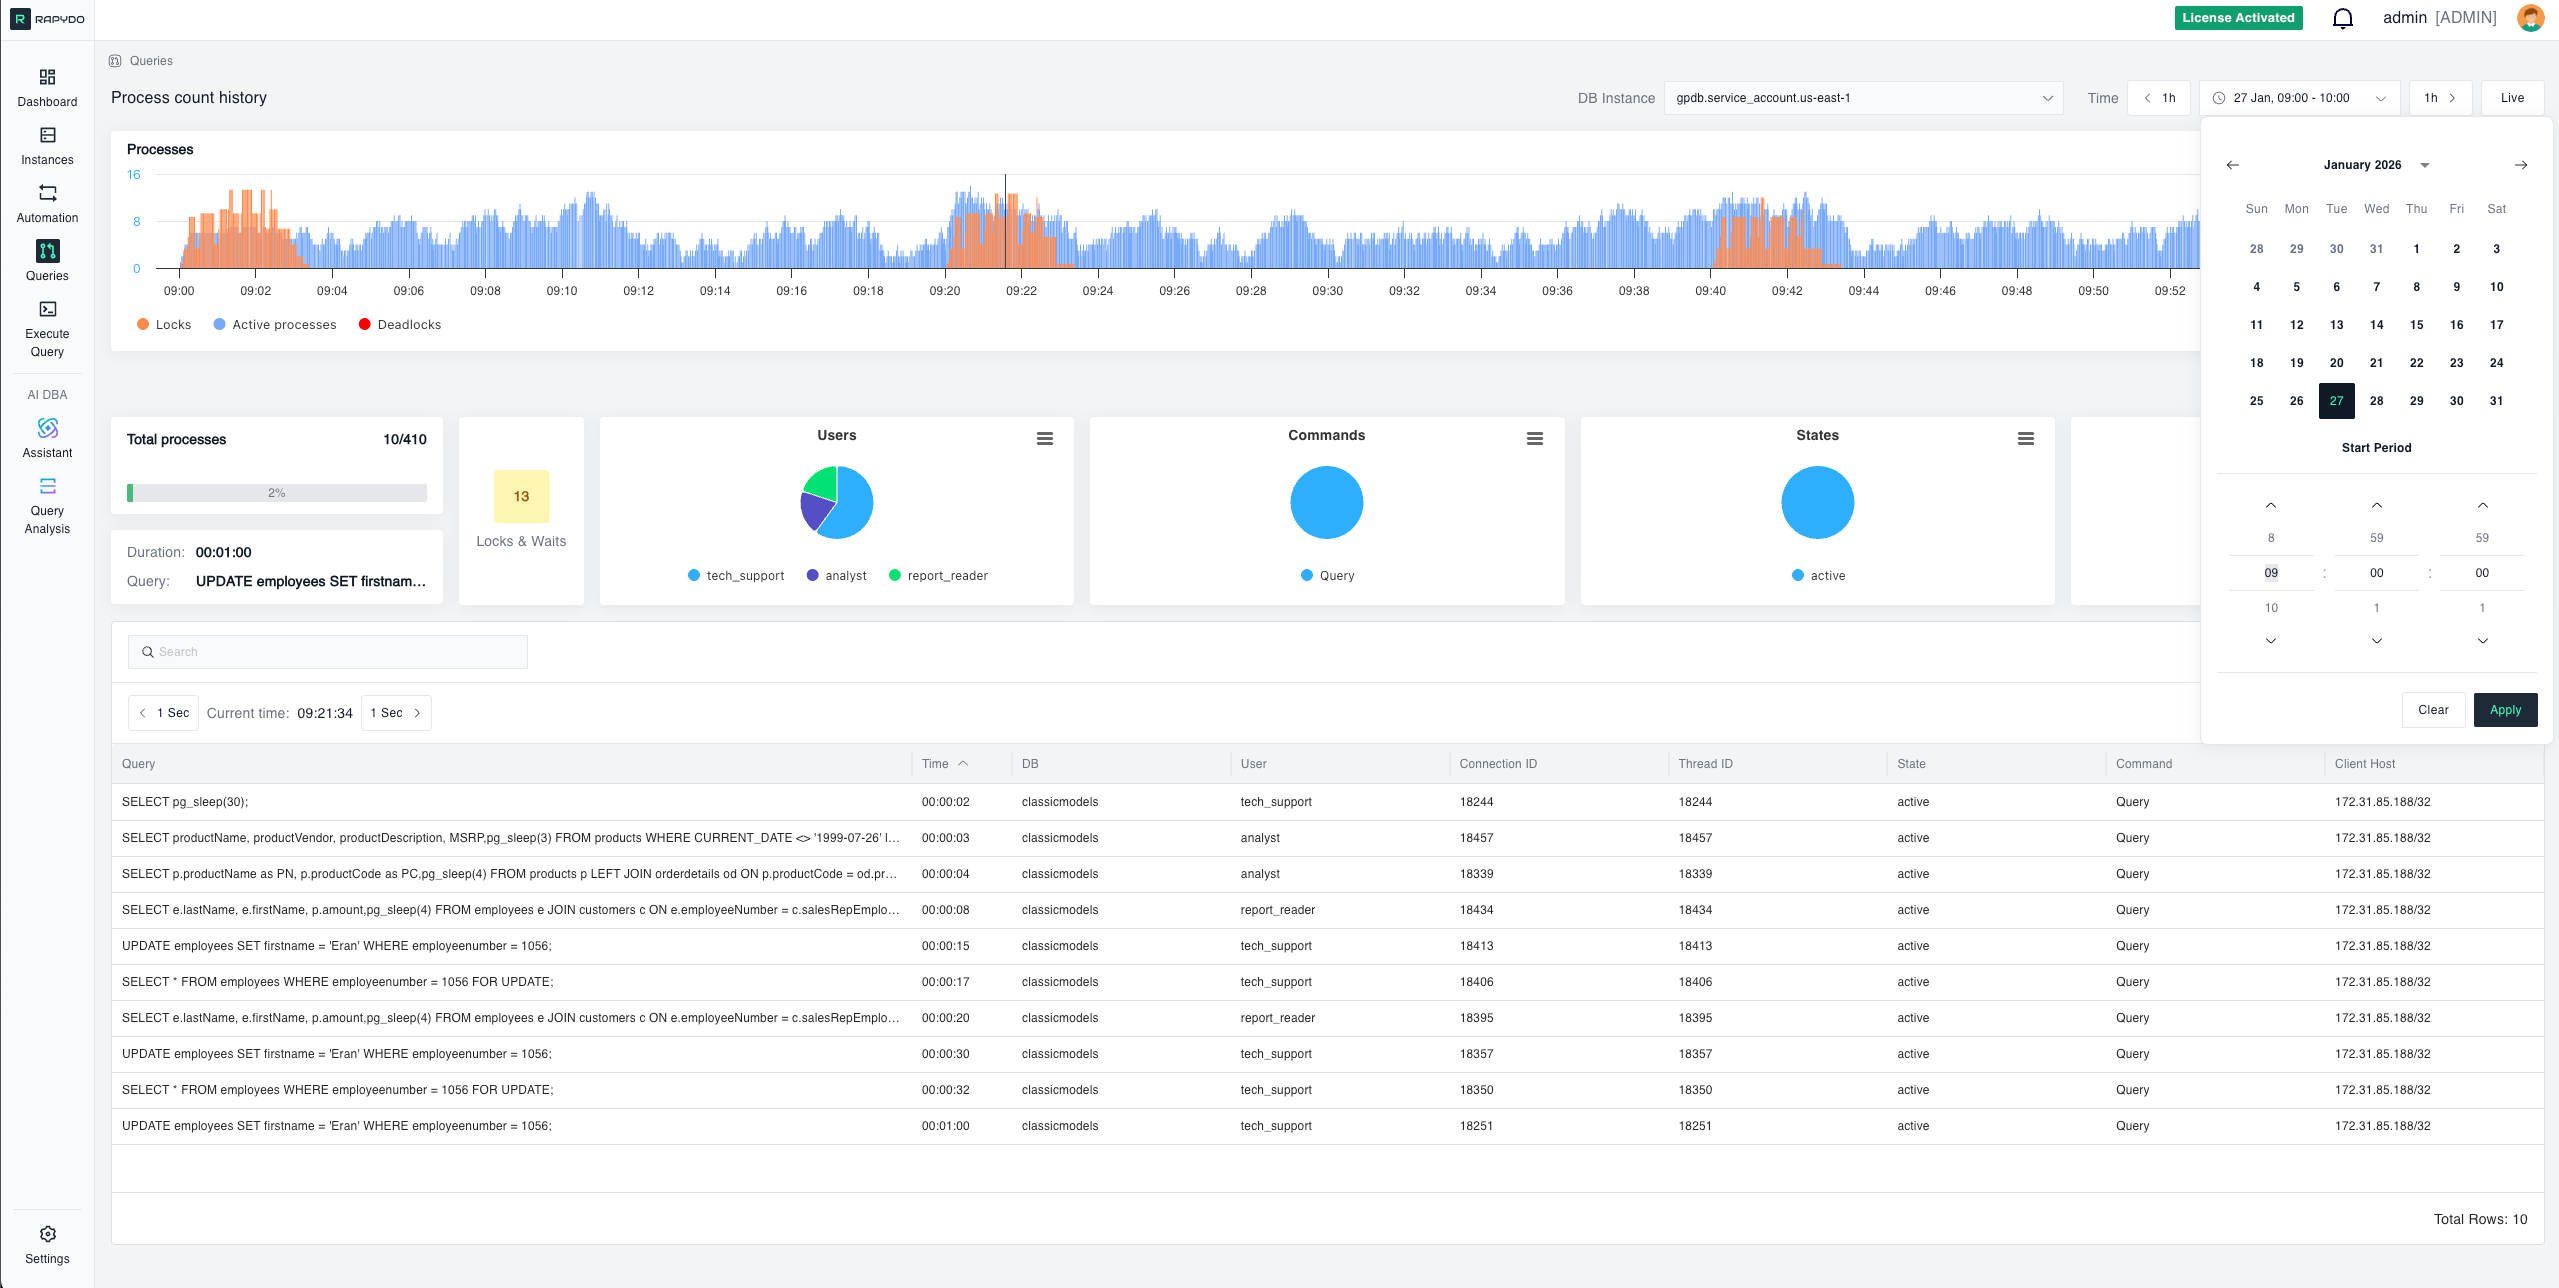
Use the DB Instance dropdown in the top filter bar to select which database instance to monitor. The view updates in real time based on the selected instance.Process Count History
The process count history chart shows three data series over time:- Active processes (blue) — the number of queries actively executing
- Locks (orange) — the number of locks held
- Deadlocks (red) — the number of deadlocks detected
Total Processes
The total processes bar provides a real-time snapshot of the number of queries currently being executed on your database. It shows the current active process count against the maximum connection limit, helping you understand the current load on your database and identify potential bottlenecks.Longest Running Query
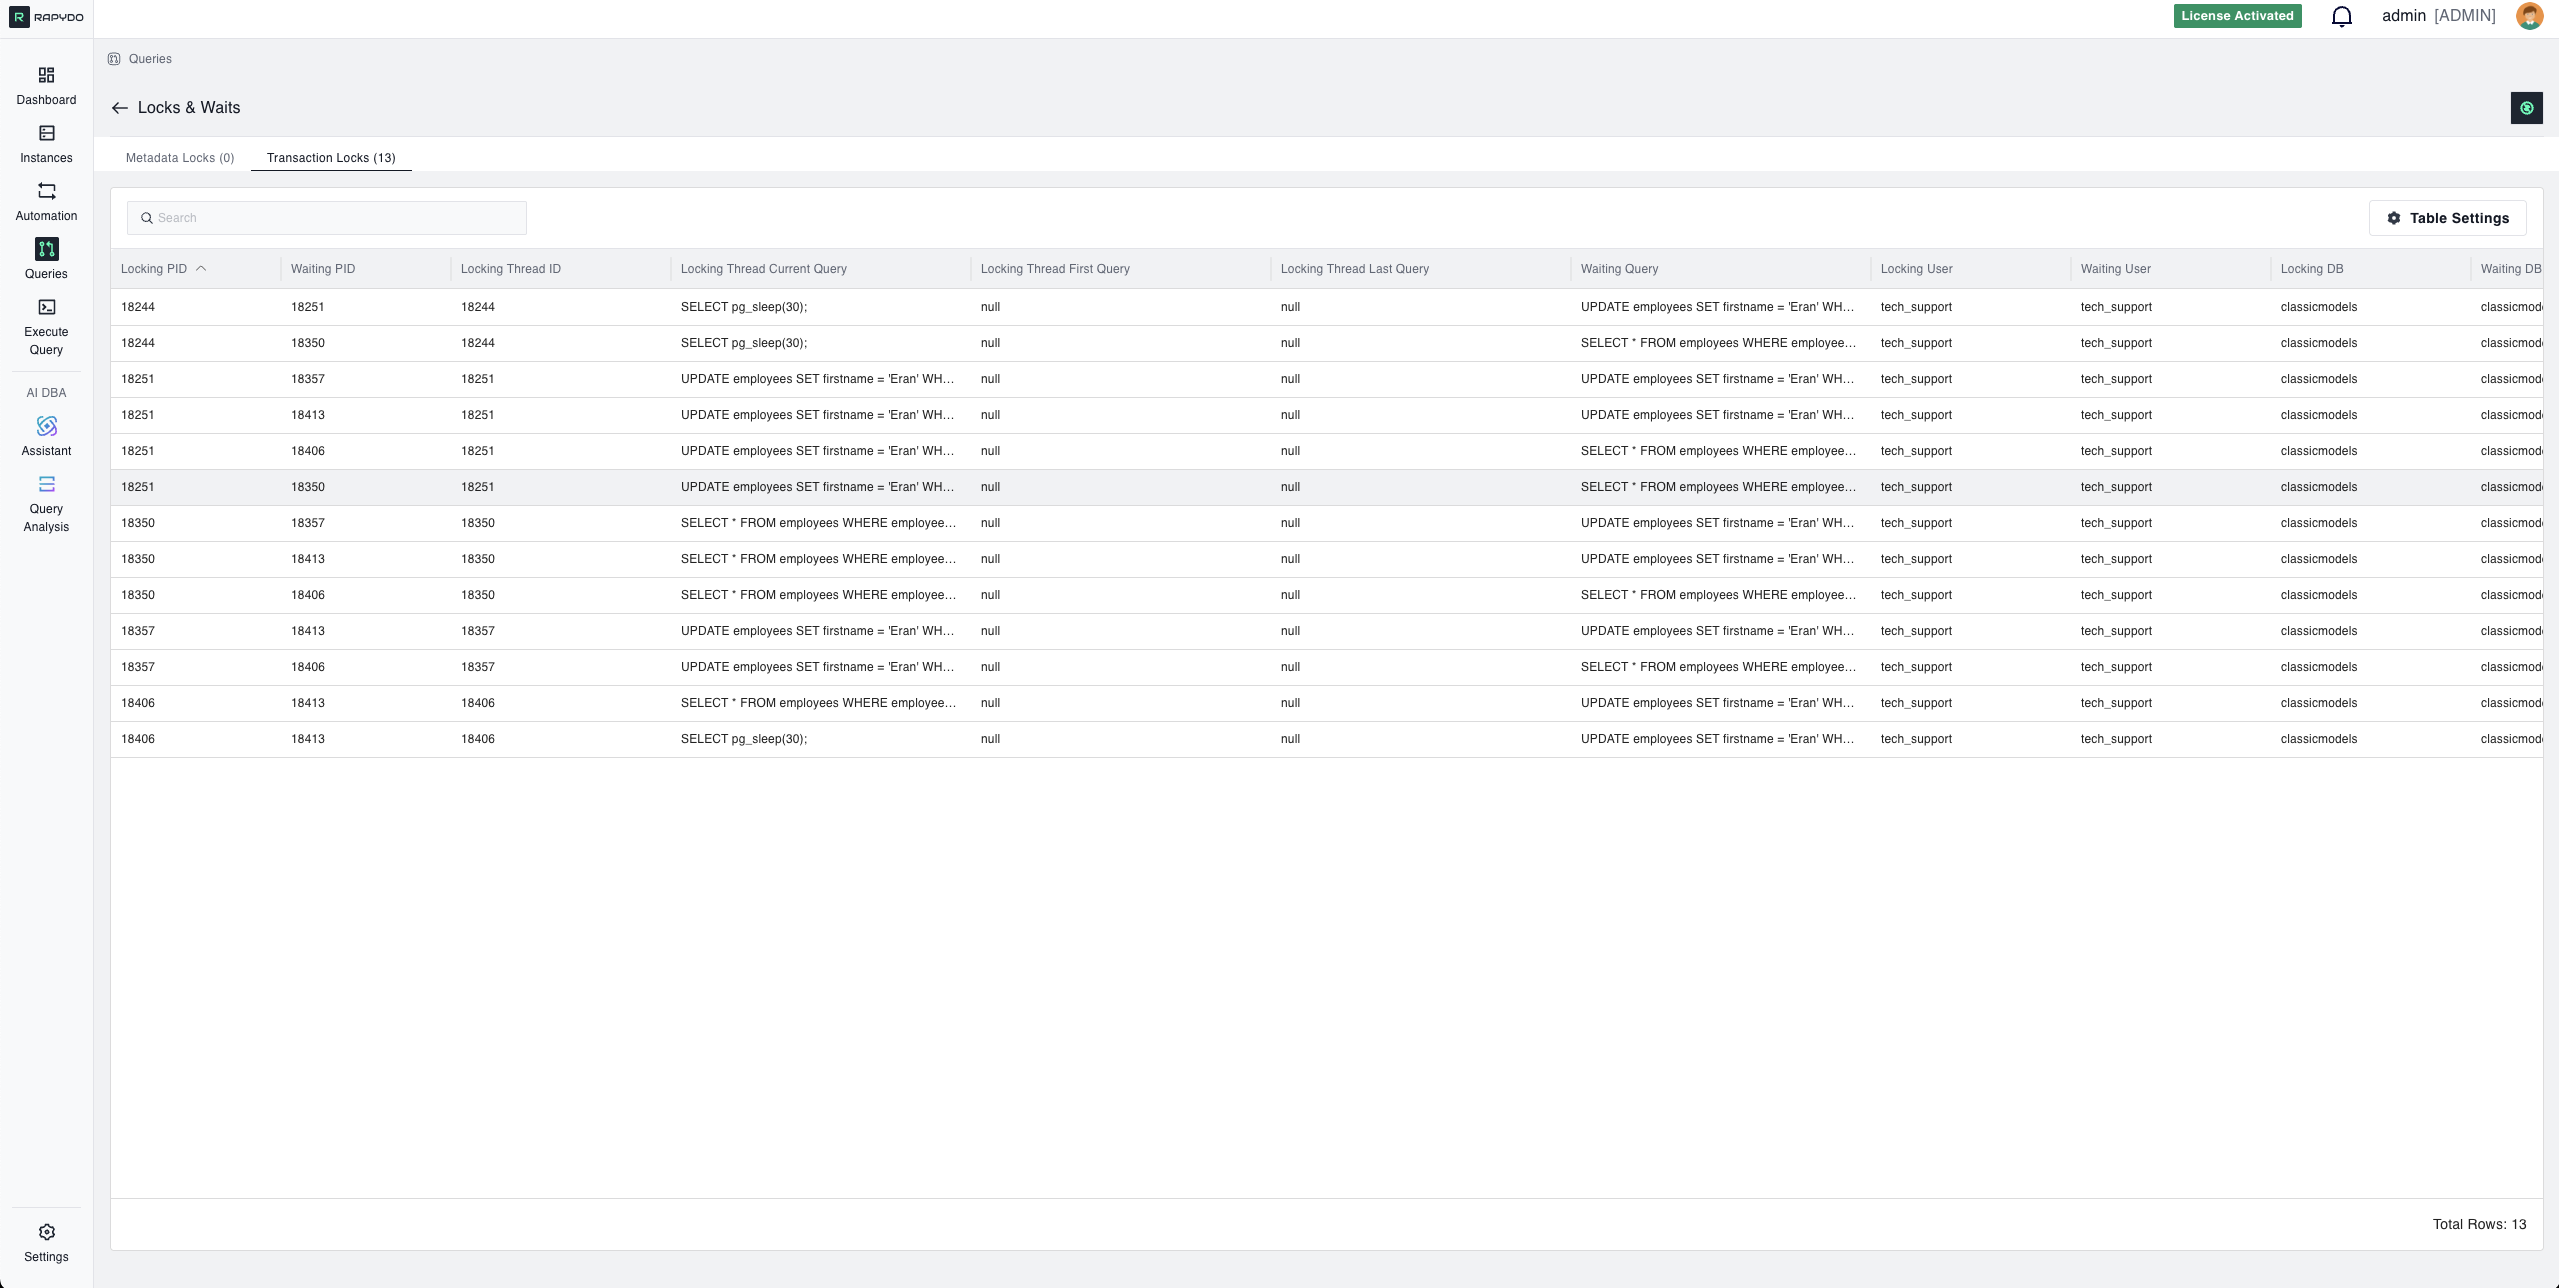
Displays the longest currently running query, including its execution duration and full query text. This real-time visibility is crucial for database administrators who need to ensure optimal performance and quick troubleshooting.Locks & Waits
The locks and waits count provides insights into the queries that are currently waiting for locks or resources to be released. This metric is essential for identifying potential bottlenecks and performance issues caused by locking contention. The count is color-coded: gray (< 10), yellow (10–20), red (≥ 20). Click to open a detailed locks table.Pie Charts
Four pie charts break down query statistics into visual segments showing the proportional distribution across your database activity:- Users — Distribution of queries by database user
- Commands — Distribution by command type (SELECT, INSERT, etc.)
- States — Distribution by query state (executing, waiting, etc.)
- Dbs — Distribution by database name
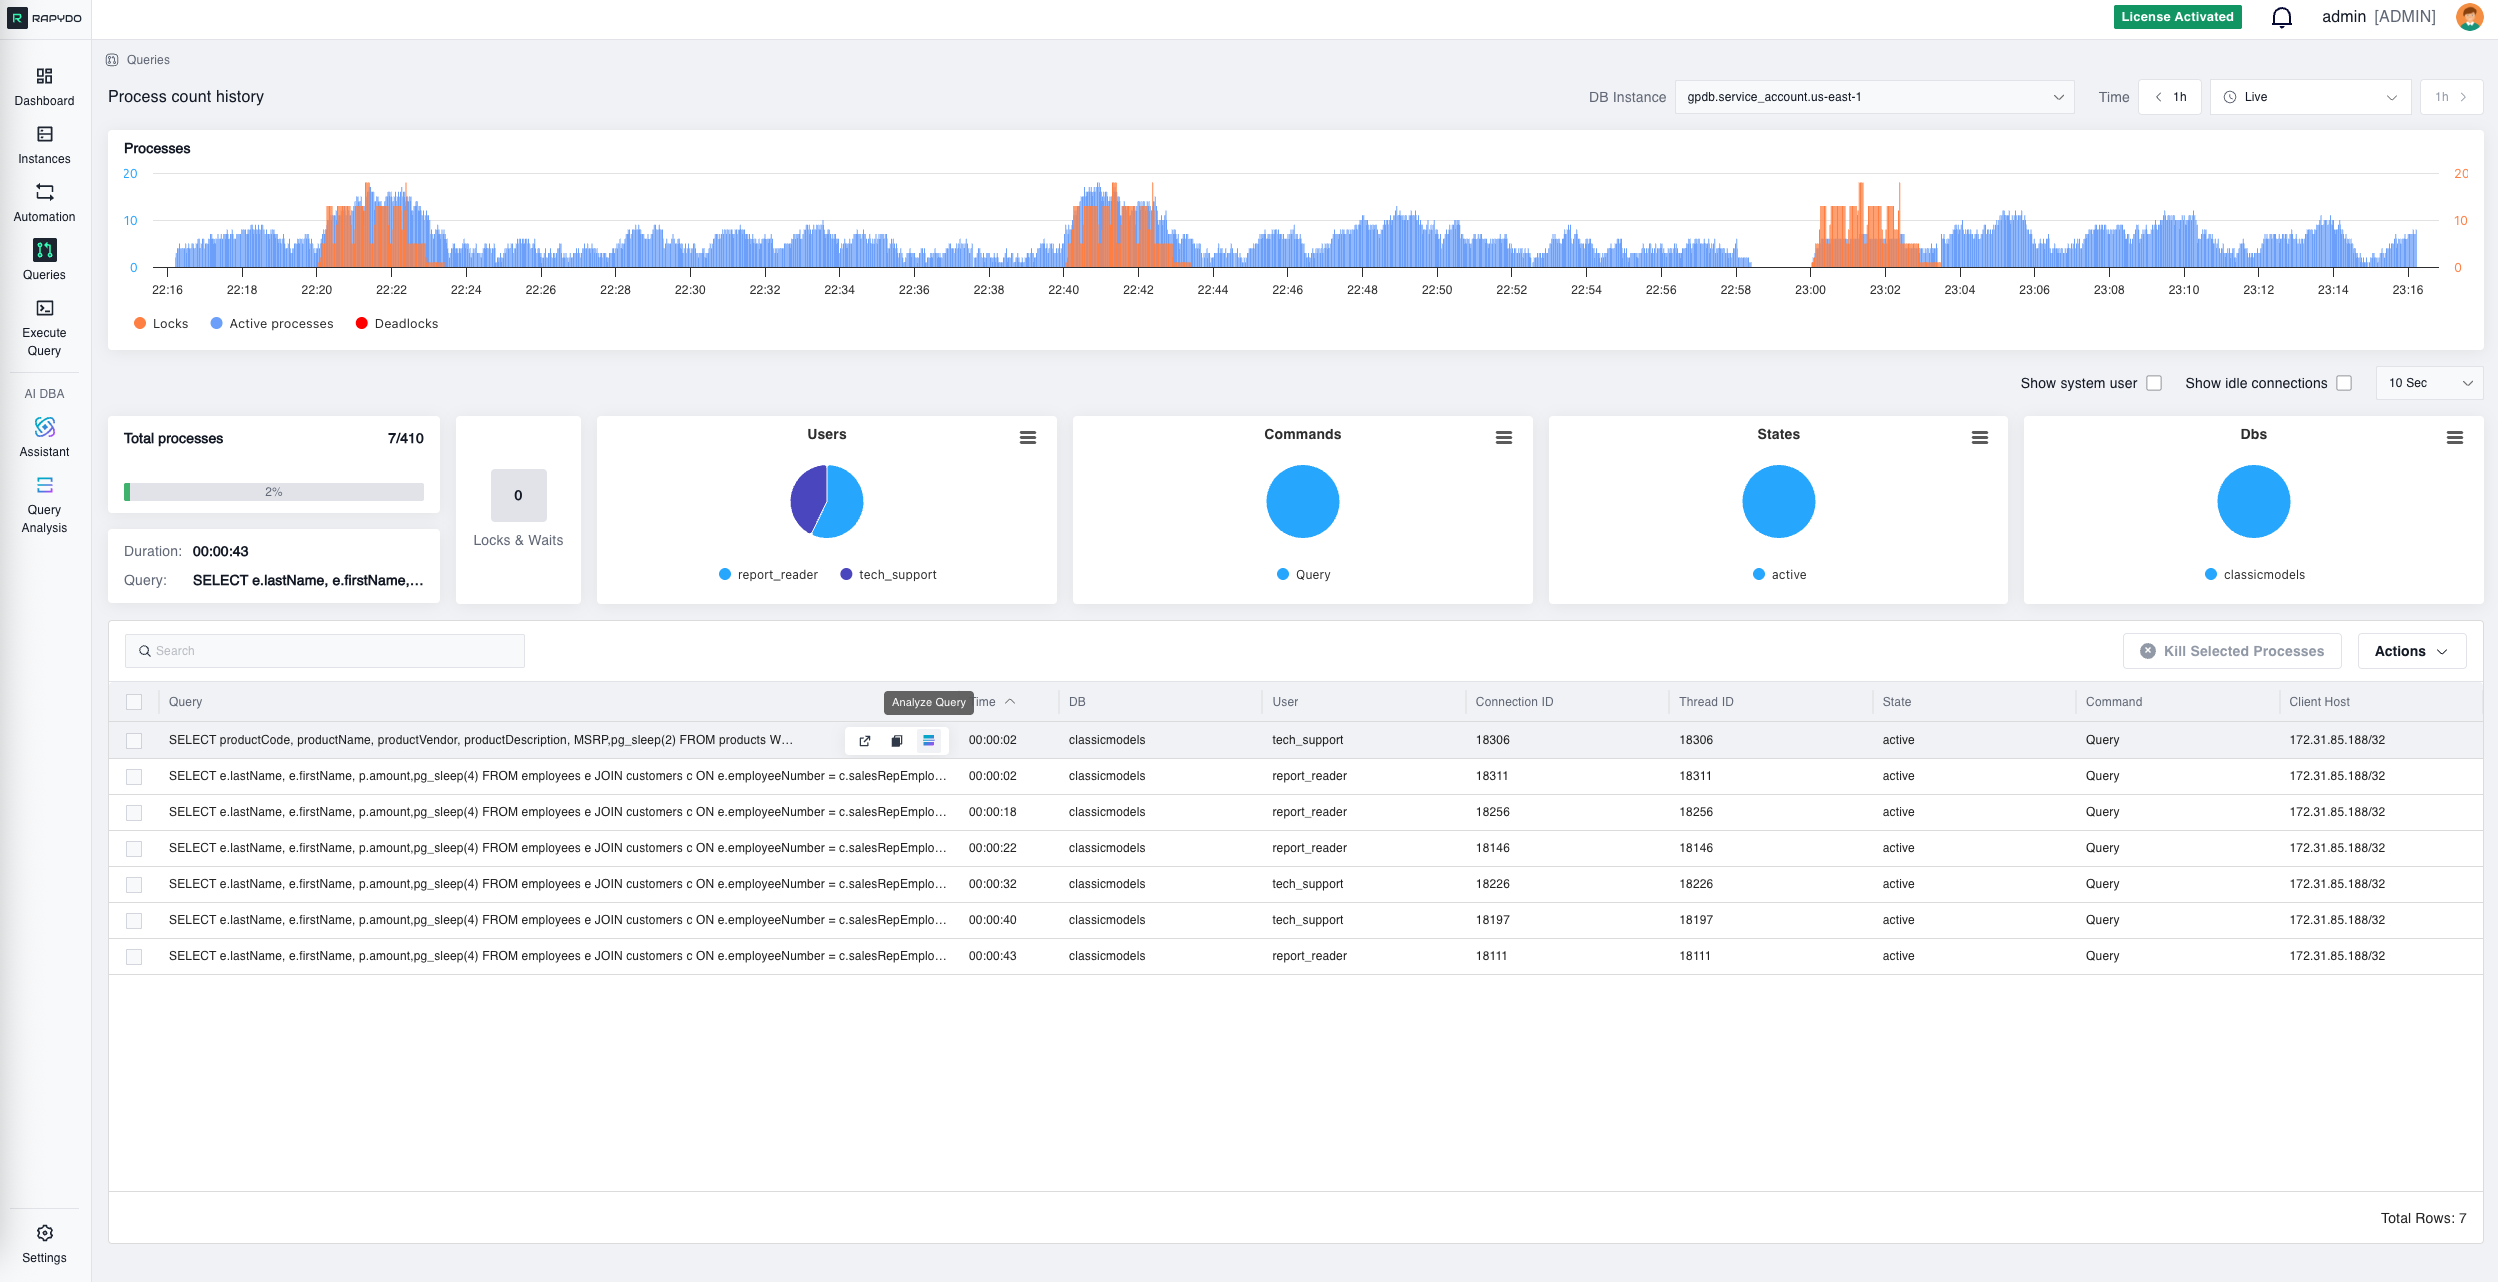
Queries Table
The queries table presents a detailed tabulation of ongoing queries and processes, including query text, execution time, user, state, command, client host, and more. Advanced filtering options let users sort and filter this data by various metrics, such as duration, to quickly isolate long-running or resource-intensive queries. Select one or more rows and click Kill selected processes to immediately terminate problematic or unresponsive queries.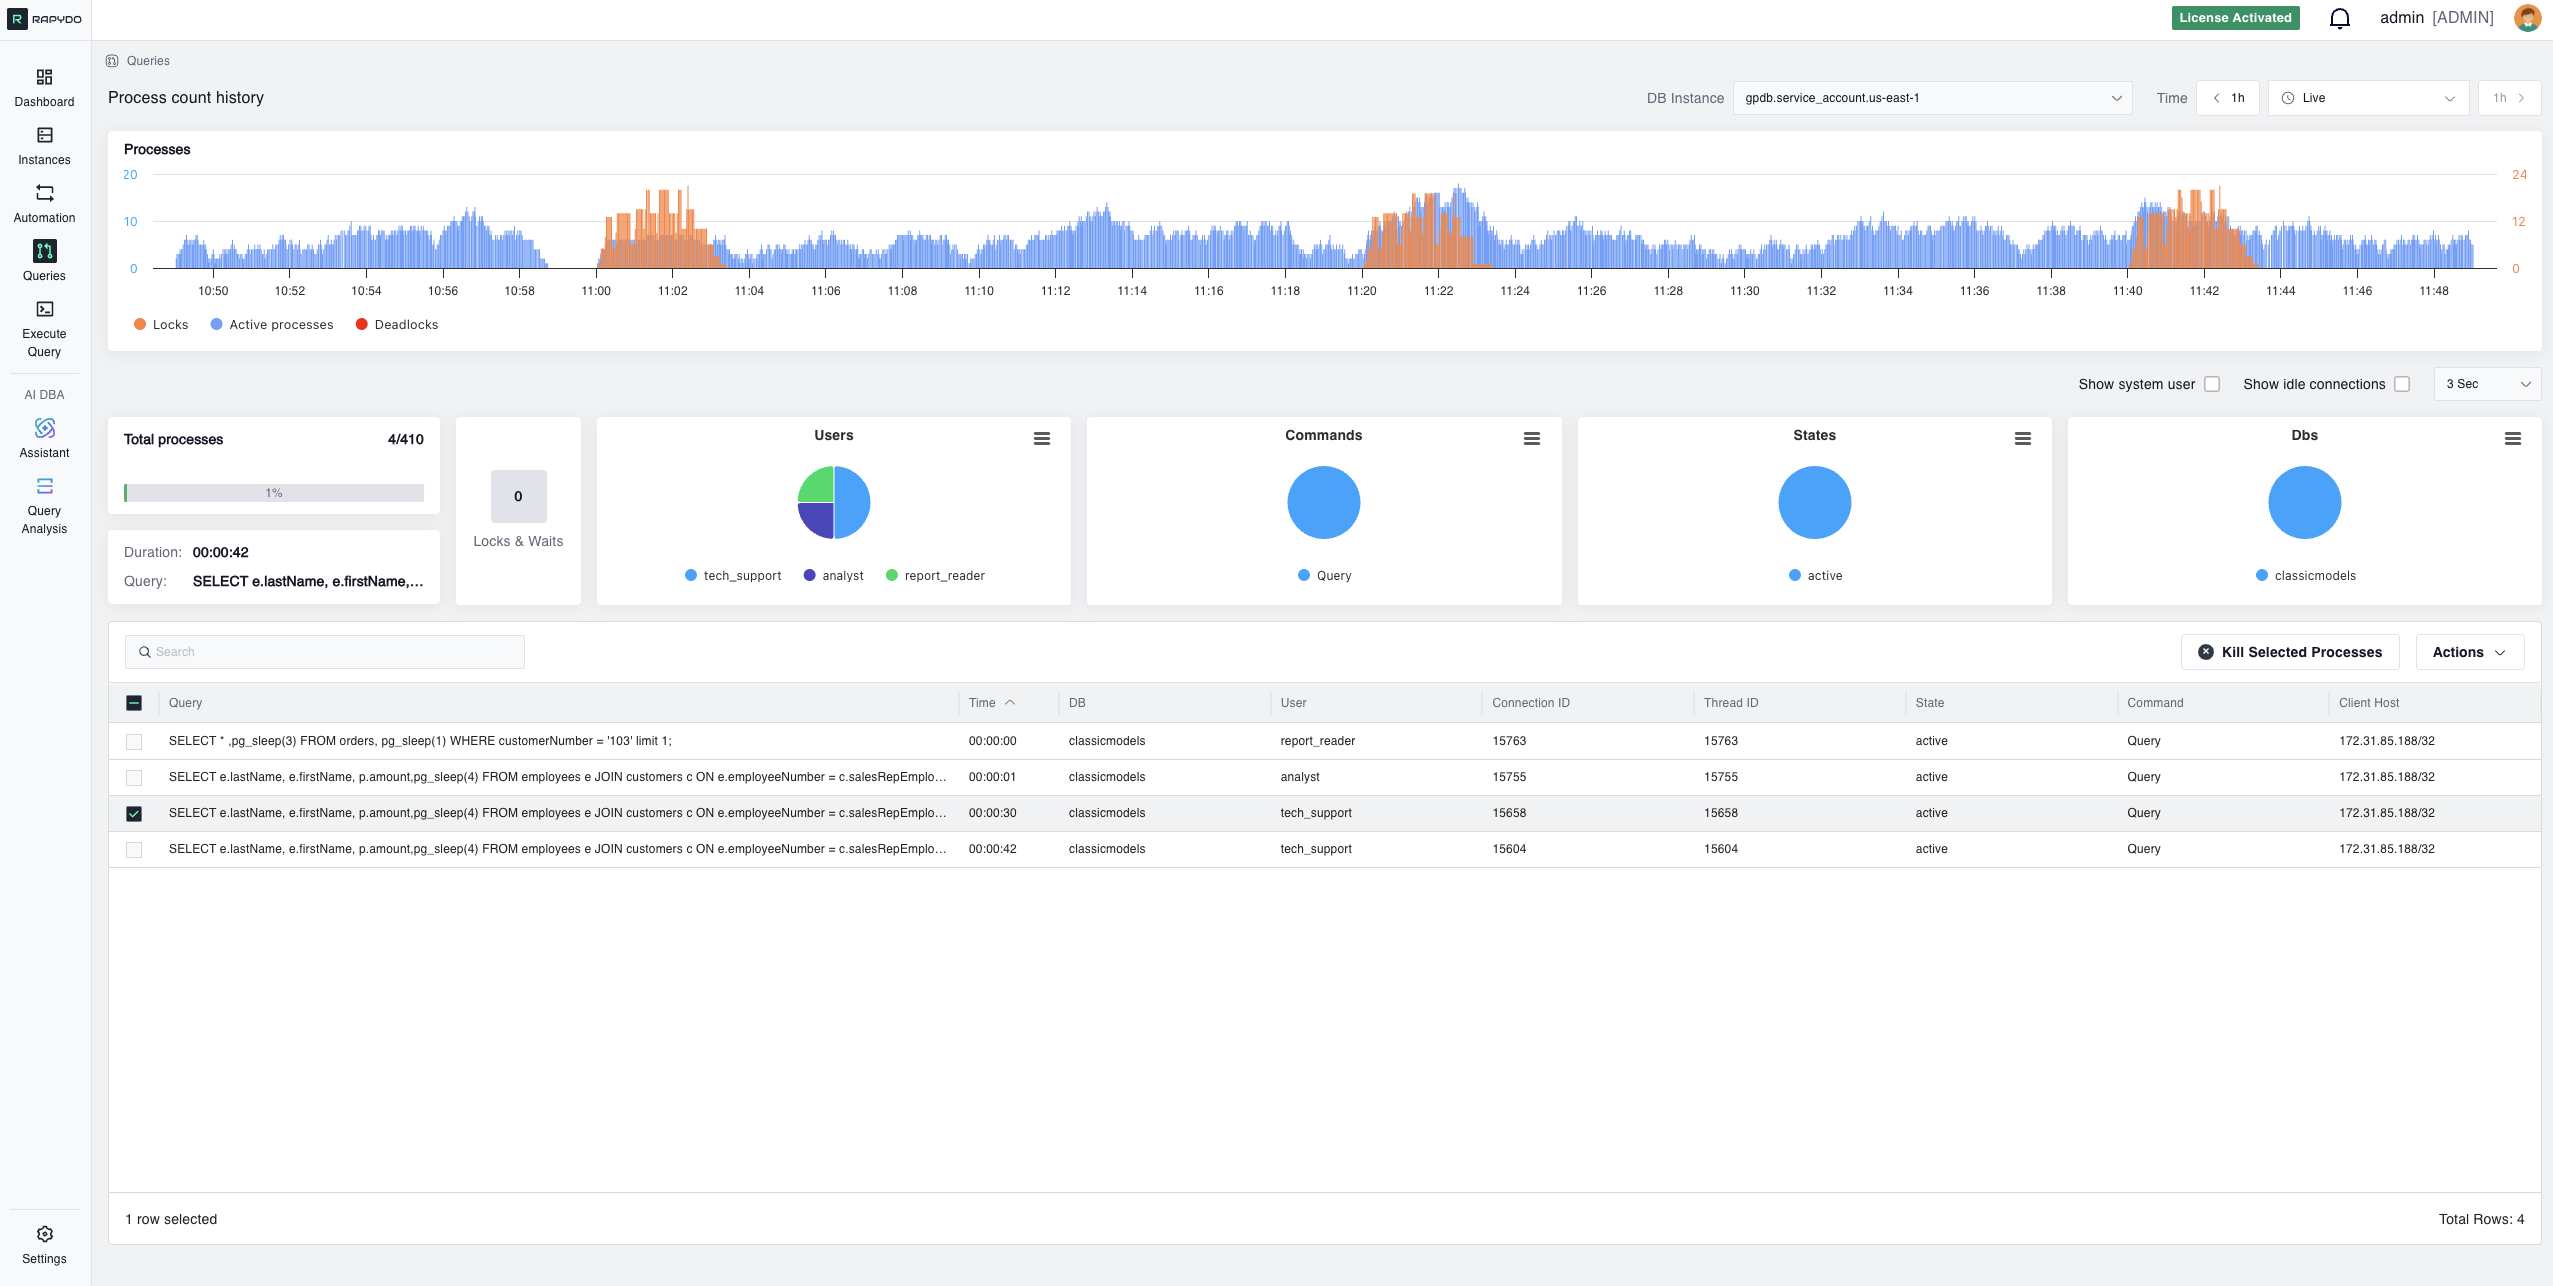
Real-time Queries

Process Count History
Locks & Waits