Database Details View
The Database Details View provides a comprehensive interface for monitoring and managing the databases connected to the system. It is divided into several sections, each serving a specific purpose to assist administrators in managing database instances effectively.Top Bar: Summary of Key Database Metrics
The top bar presents an overview of the key metrics across all databases connected to the system. It includes:- CPU Usage: Displays the maximum CPU utilization percentage among the databases.
- Available RAM: Shows the maximum amount of available RAM for the connected databases.
- Connections: Shows the maximum number of active connections across databases.
- Duration: Shows the maximum session duration.
- Users: Displays the number of active users for the database with the highest activity.
- Locks: Indicates the number of database locks on the most utilized database.
- Databases: Displays the total number of databases in the system.
- Hosts: Shows the number of hosts running databases.
- IOPS (Input/Output Operations Per Second): Displays the IOPS for the database under the highest load.
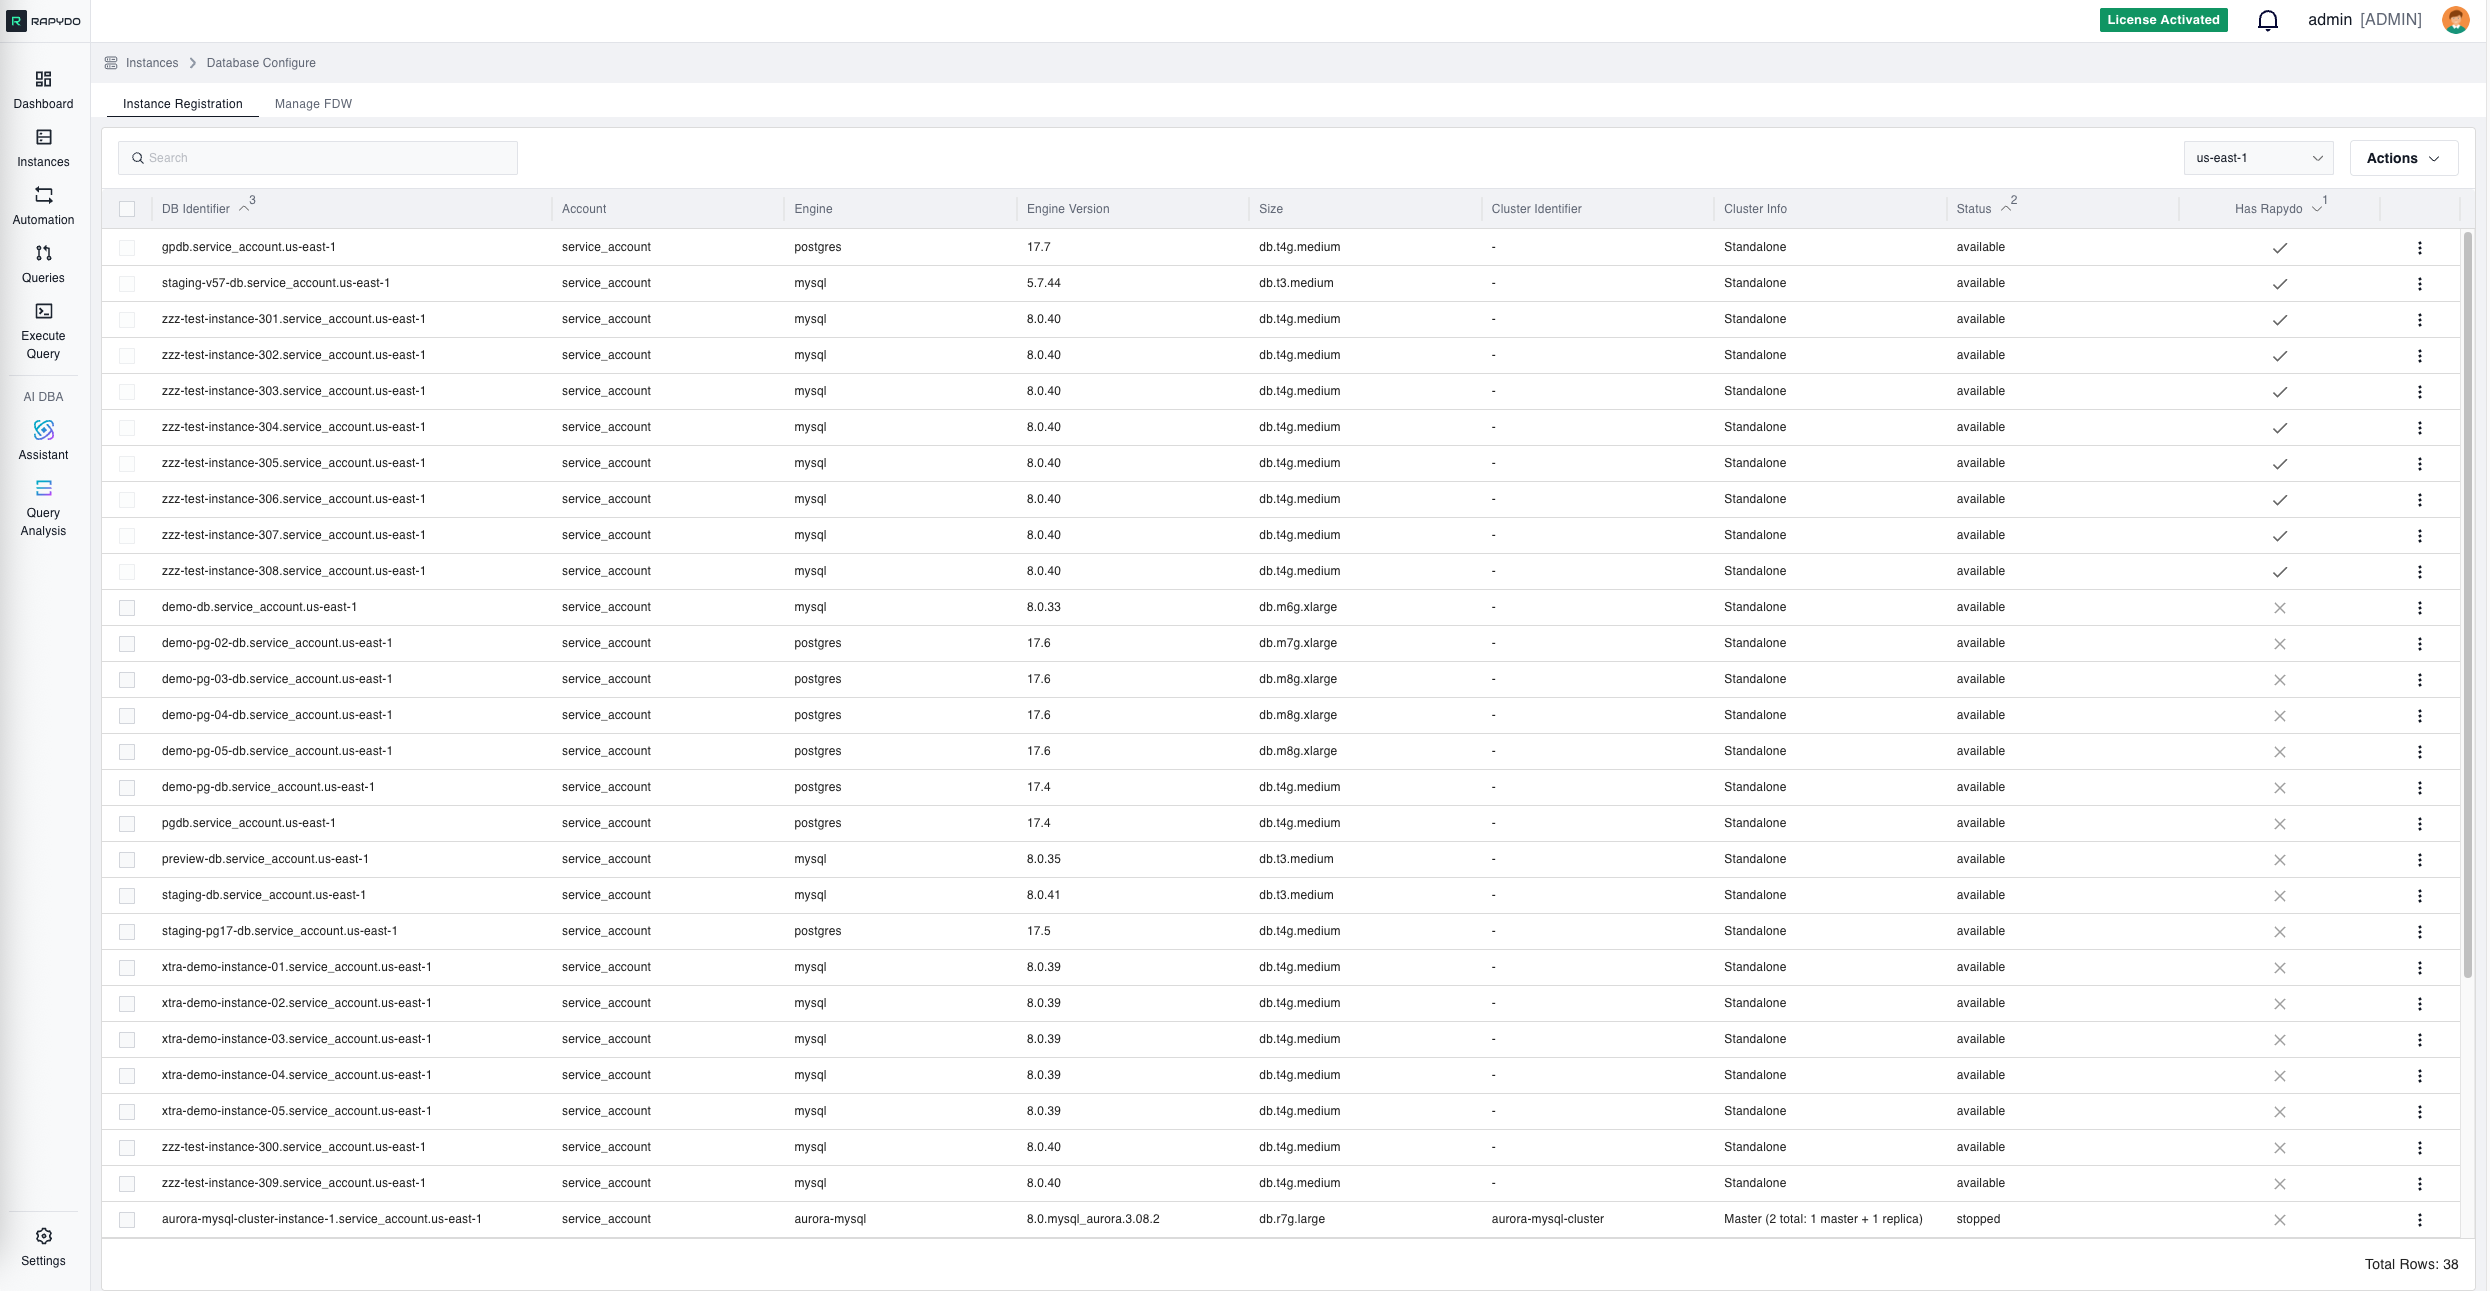
Configured Databases Table
The table presents all currently monitored databases with real-time performance data for each instance. Columns include:
Click the Configure Databases button to open the databases configuration page and add or remove instances from monitoring.
Configuration View: Database Connections

Supply RDS Credentials Modal
When deploying Rapydo to a database, the Supply RDS Credentials modal prompts for your Amazon RDS master credentials:- Username: The master username for the RDS instance.
- Password: The corresponding master password.
Deployment Process
When you click “Deploy Rapydo” and provide your RDS credentials, the following setup occurs automatically based on your database engine:PostgreSQL Setup
MySQL Setup
Required Privileges Explained
PostgreSQL Privileges
- rds_superuser View all user sessions in pg_stat_activity, not just monitoring user’s own sessions
- pg_monitor Access to all pg_stat_* views for performance monitoring
- pg_read_all_settings Read database configuration for optimization recommendations
- pg_read_all_stats Access to detailed database statistics
- pg_stat_scan_tables Analyze table sizes and storage usage
MySQL Privileges
- PROCESS Required - View all user sessions in
SHOW PROCESSLIST - SELECT Read performance schema tables and system statistics
- EXECUTE Run RDS procedures like
mysql.rds_kill_query()andmysql.rds_kill()for query termination.
Security Notes
- Credentials are encrypted and used only for initial setup
- Read-only monitoring - no data modification capabilities
- Dedicated user - isolated from your application users
- Minimal required access - only what’s needed for database monitoring