> ## Documentation Index
> Fetch the complete documentation index at: https://docs.rapydo.io/llms.txt
> Use this file to discover all available pages before exploring further.
# Database details view
## Database Details View
The **Database Details View** provides a comprehensive interface for monitoring and managing the databases connected to the system. It is divided into several sections, each serving a specific purpose to assist administrators in managing database instances effectively.
### Top Bar: Summary of Key Database Metrics
The top bar presents an overview of the key metrics across all databases connected to the system. It includes:
* **CPU Usage:** Displays the maximum CPU utilization percentage among the databases.
* **Available RAM:** Shows the maximum amount of available RAM for the connected databases.
* **Connections:** Shows the maximum number of active connections across databases.
* **Duration:** Shows the maximum session duration.
* **Users:** Displays the number of active users for the database with the highest activity.
* **Locks:** Indicates the number of database locks on the most utilized database.
* **Databases:** Displays the total number of databases in the system.
* **Hosts:** Shows the number of hosts running databases.
* **IOPS (Input/Output Operations Per Second):** Displays the IOPS for the database under the highest load.
This bar gives a quick snapshot of overall system performance.
### Configured Databases Table
The table presents all currently monitored databases with real-time performance data for each instance. Columns include:
| Column | Description |
| --------------------- | ------------------------------------------------------ |
| **DB Name** | The unique identifier of the database instance |
| **Account** | The AWS account ID the instance belongs to |
| **Region** | The AWS region where the instance is hosted |
| **Availability Zone** | The specific availability zone of the instance |
| **Engine** | The database engine (e.g., MySQL, PostgreSQL) |
| **Engine Version** | The version of the database engine |
| **Size** | The instance class (e.g., db.t3.medium) |
| **Provisioned IOPS** | Provisioned IOPS value if applicable |
| **Parameter Groups** | The parameter group(s) applied to the instance |
| **Metrics Available** | Whether CloudWatch metrics are available (Yes / No) |
| **CPU** | Current CPU utilization (%) |
| **Memory** | Available free memory (formatted as KB / MB / GB) |
| **Connections** | Max connections / active connections / running queries |
| **Max Duration** | Duration of the longest currently running query |
| **Users** | Number of active users |
| **Locks** | Number of current lock waits |
| **Databases** | Number of databases on the instance |
| **Hosts** | Number of connected hosts |
| **Read IOPS** | Current read I/O operations per second |
| **Write IOPS** | Current write I/O operations per second |
Click the **Configure Databases** button to open the databases configuration page and add or remove instances from monitoring.
### Configuration View: Database Connections
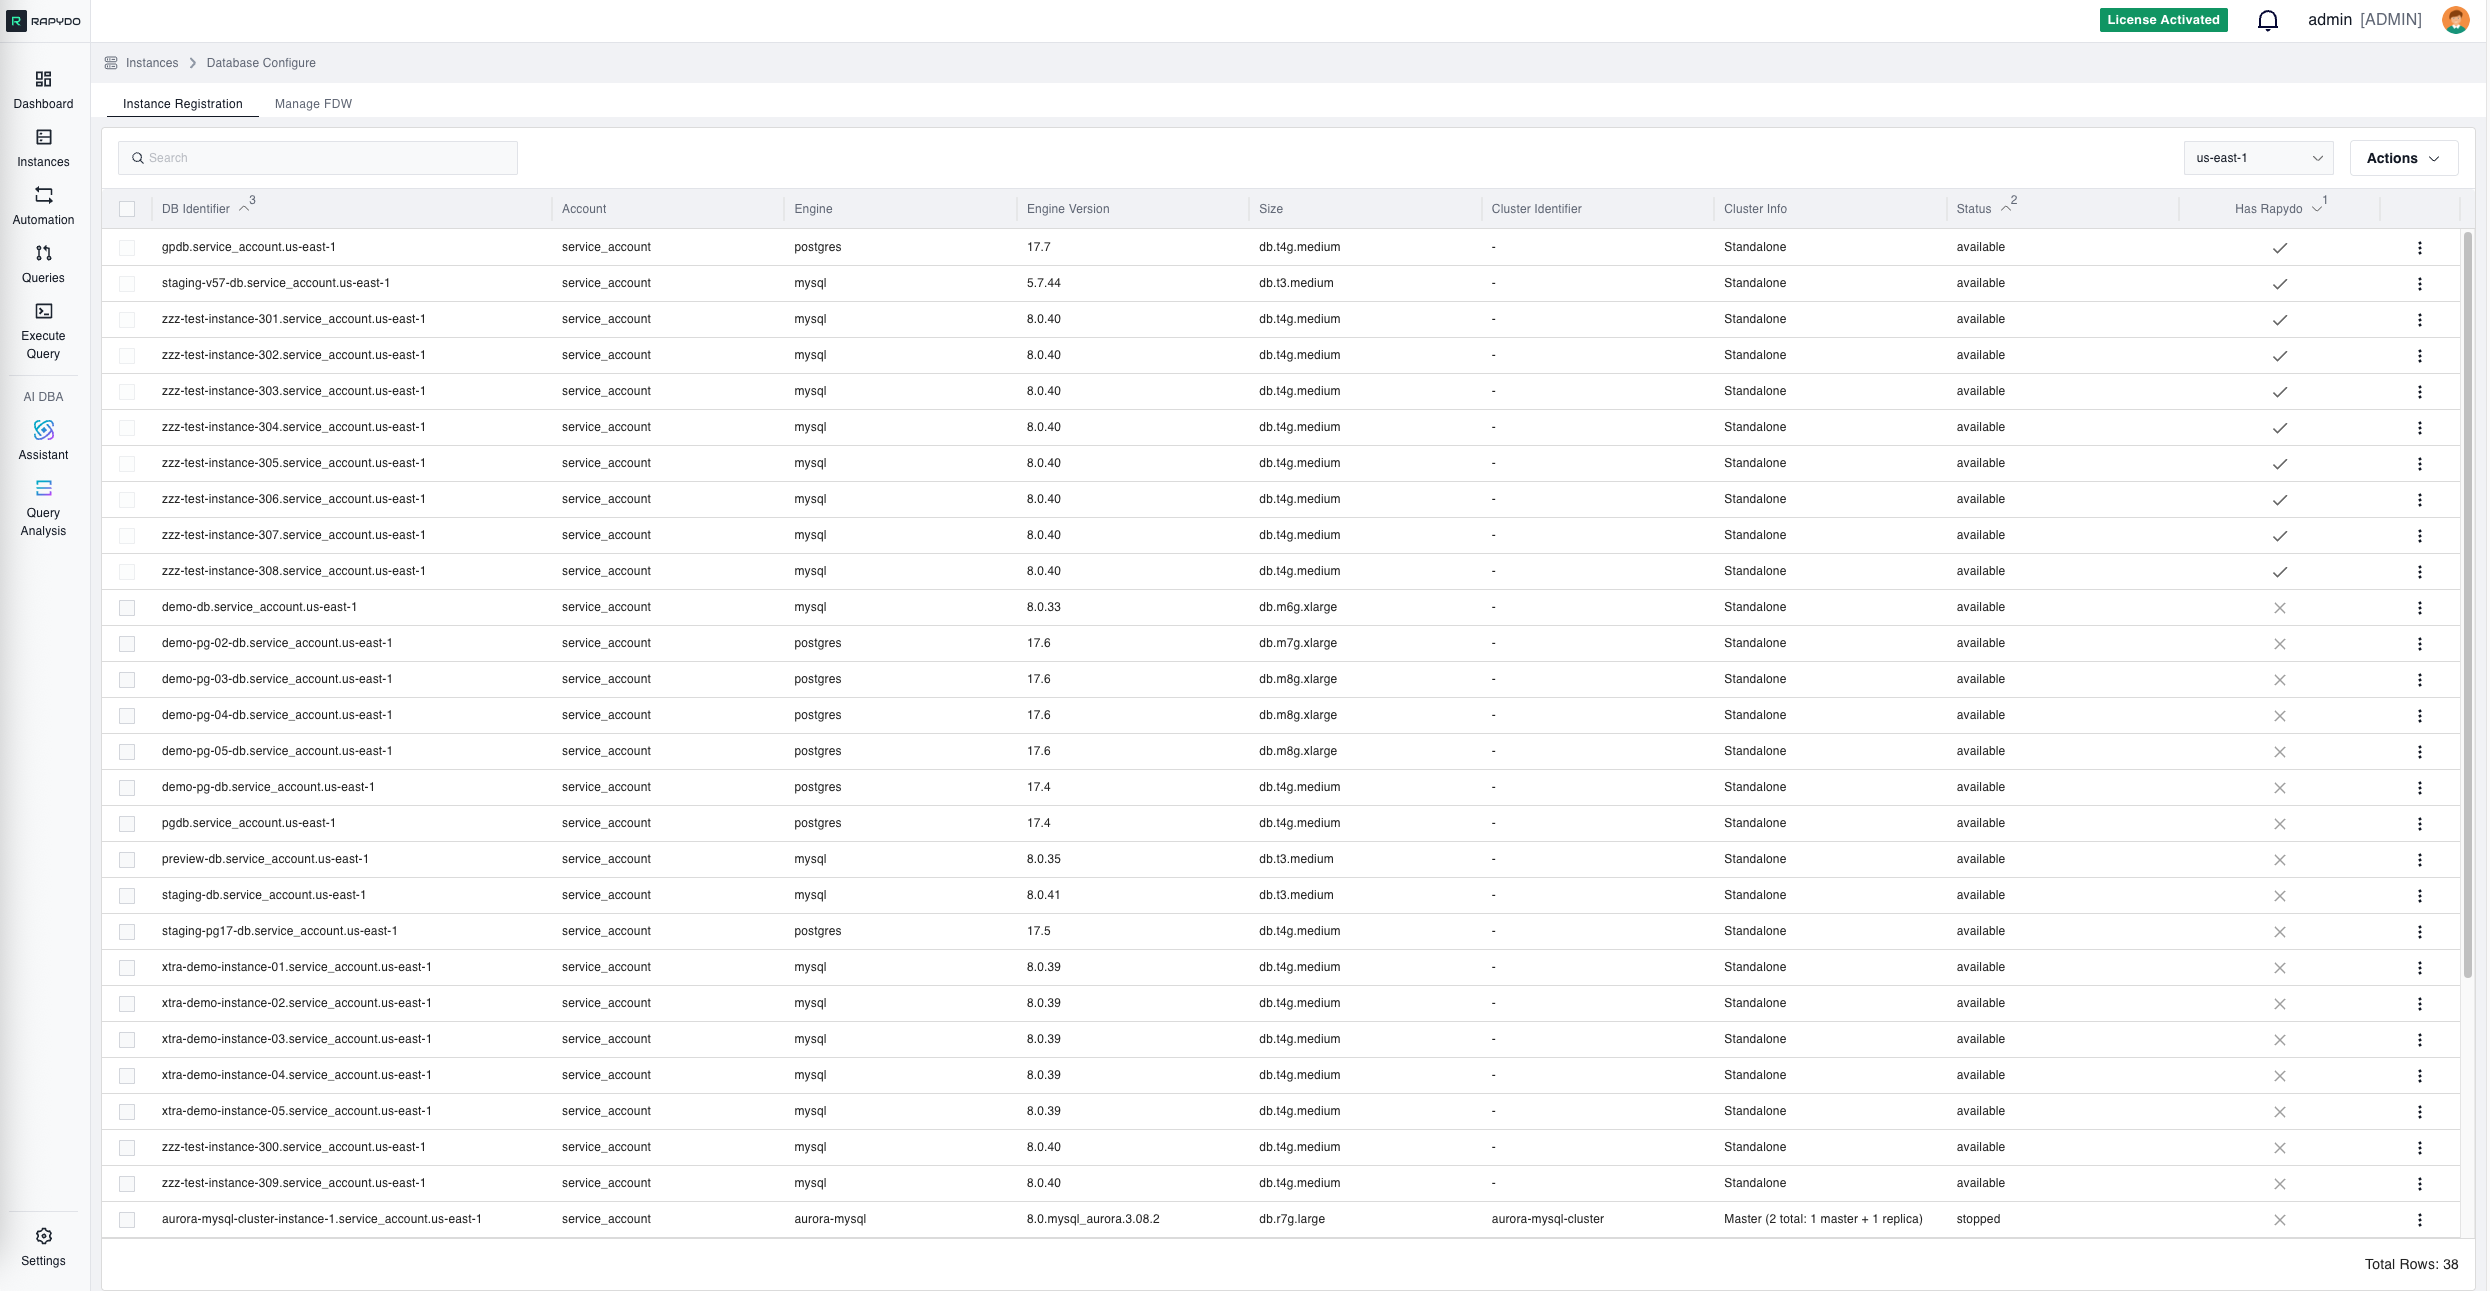
 This section allows administrators to connect new databases to the system. It presents the list of databases that are available for connection and those that are already configured. Administrators can check off the databases they want to add to the system.
This view also enables administrators to review and update the list of databases being actively monitored, ensuring that the system always has the latest database connections.
### Supply RDS Credentials Modal
When deploying Rapydo to a database, the **Supply RDS Credentials** modal prompts for your Amazon RDS master credentials:
* **Username:** The master username for the RDS instance.
* **Password:** The corresponding master password.
These credentials are securely encrypted and used only during the one-time installation process. Click **Deploy Rapydo** to confirm, or **Cancel** to close without changes.
## Deployment Process
When you click **"Deploy Rapydo"** and provide your RDS credentials, the following setup occurs automatically based on your database engine:
## PostgreSQL Setup
```sql theme={null}
-- 1. Create dedicated monitoring user
CREATE USER rapydo_admin WITH PASSWORD '[secure_generated_password]' INHERIT;
-- 2. Grant comprehensive monitoring privileges
GRANT rds_superuser, pg_monitor, pg_read_all_settings, pg_read_all_stats, pg_stat_scan_tables
TO rapydo_admin;
-- 3. Enable query statistics tracking
CREATE EXTENSION IF NOT EXISTS pg_stat_statements;
```
## MySQL Setup
```sql theme={null}
-- 1. Create dedicated monitoring user
CREATE USER 'rapydo_monitor'@'%' IDENTIFIED BY '[secure_generated_password]';
-- 2. Grant monitoring privileges
GRANT PROCESS, EXECUTE, SELECT ON *.* TO 'rapydo_monitor'@'%';
-- 3. Apply changes
FLUSH PRIVILEGES;
```
## Required Privileges Explained
### PostgreSQL Privileges
* **rds\_superuser** View all user sessions in pg\_stat\_activity, not just monitoring user's own sessions
* **pg\_monitor** Access to all pg\_stat\_\* views for performance monitoring
* **pg\_read\_all\_settings** Read database configuration for optimization recommendations
* **pg\_read\_all\_stats** Access to detailed database statistics
* **pg\_stat\_scan\_tables** Analyze table sizes and storage usage
### MySQL Privileges
* **PROCESS** **Required** - View all user sessions in `SHOW PROCESSLIST`
* **SELECT** Read performance schema tables and system statistics
* **EXECUTE** Run RDS procedures like `mysql.rds_kill_query()` and `mysql.rds_kill()` for query termination.
### Security Notes
* **Credentials are encrypted** and used only for initial setup
* **Read-only monitoring** - no data modification capabilities
* **Dedicated user** - isolated from your application users
* **Minimal required access** - only what's needed for database monitoring
**Your master credentials are never stored and are only used during this one-time setup process.**
This section allows administrators to connect new databases to the system. It presents the list of databases that are available for connection and those that are already configured. Administrators can check off the databases they want to add to the system.
This view also enables administrators to review and update the list of databases being actively monitored, ensuring that the system always has the latest database connections.
### Supply RDS Credentials Modal
When deploying Rapydo to a database, the **Supply RDS Credentials** modal prompts for your Amazon RDS master credentials:
* **Username:** The master username for the RDS instance.
* **Password:** The corresponding master password.
These credentials are securely encrypted and used only during the one-time installation process. Click **Deploy Rapydo** to confirm, or **Cancel** to close without changes.
## Deployment Process
When you click **"Deploy Rapydo"** and provide your RDS credentials, the following setup occurs automatically based on your database engine:
## PostgreSQL Setup
```sql theme={null}
-- 1. Create dedicated monitoring user
CREATE USER rapydo_admin WITH PASSWORD '[secure_generated_password]' INHERIT;
-- 2. Grant comprehensive monitoring privileges
GRANT rds_superuser, pg_monitor, pg_read_all_settings, pg_read_all_stats, pg_stat_scan_tables
TO rapydo_admin;
-- 3. Enable query statistics tracking
CREATE EXTENSION IF NOT EXISTS pg_stat_statements;
```
## MySQL Setup
```sql theme={null}
-- 1. Create dedicated monitoring user
CREATE USER 'rapydo_monitor'@'%' IDENTIFIED BY '[secure_generated_password]';
-- 2. Grant monitoring privileges
GRANT PROCESS, EXECUTE, SELECT ON *.* TO 'rapydo_monitor'@'%';
-- 3. Apply changes
FLUSH PRIVILEGES;
```
## Required Privileges Explained
### PostgreSQL Privileges
* **rds\_superuser** View all user sessions in pg\_stat\_activity, not just monitoring user's own sessions
* **pg\_monitor** Access to all pg\_stat\_\* views for performance monitoring
* **pg\_read\_all\_settings** Read database configuration for optimization recommendations
* **pg\_read\_all\_stats** Access to detailed database statistics
* **pg\_stat\_scan\_tables** Analyze table sizes and storage usage
### MySQL Privileges
* **PROCESS** **Required** - View all user sessions in `SHOW PROCESSLIST`
* **SELECT** Read performance schema tables and system statistics
* **EXECUTE** Run RDS procedures like `mysql.rds_kill_query()` and `mysql.rds_kill()` for query termination.
### Security Notes
* **Credentials are encrypted** and used only for initial setup
* **Read-only monitoring** - no data modification capabilities
* **Dedicated user** - isolated from your application users
* **Minimal required access** - only what's needed for database monitoring
**Your master credentials are never stored and are only used during this one-time setup process.**