> ## Documentation Index
> Fetch the complete documentation index at: https://docs.rapydo.io/llms.txt
> Use this file to discover all available pages before exploring further.
# Alert Rules - Metrics and Notifications
> Complete reference for Alert Rules configuration
## Overview
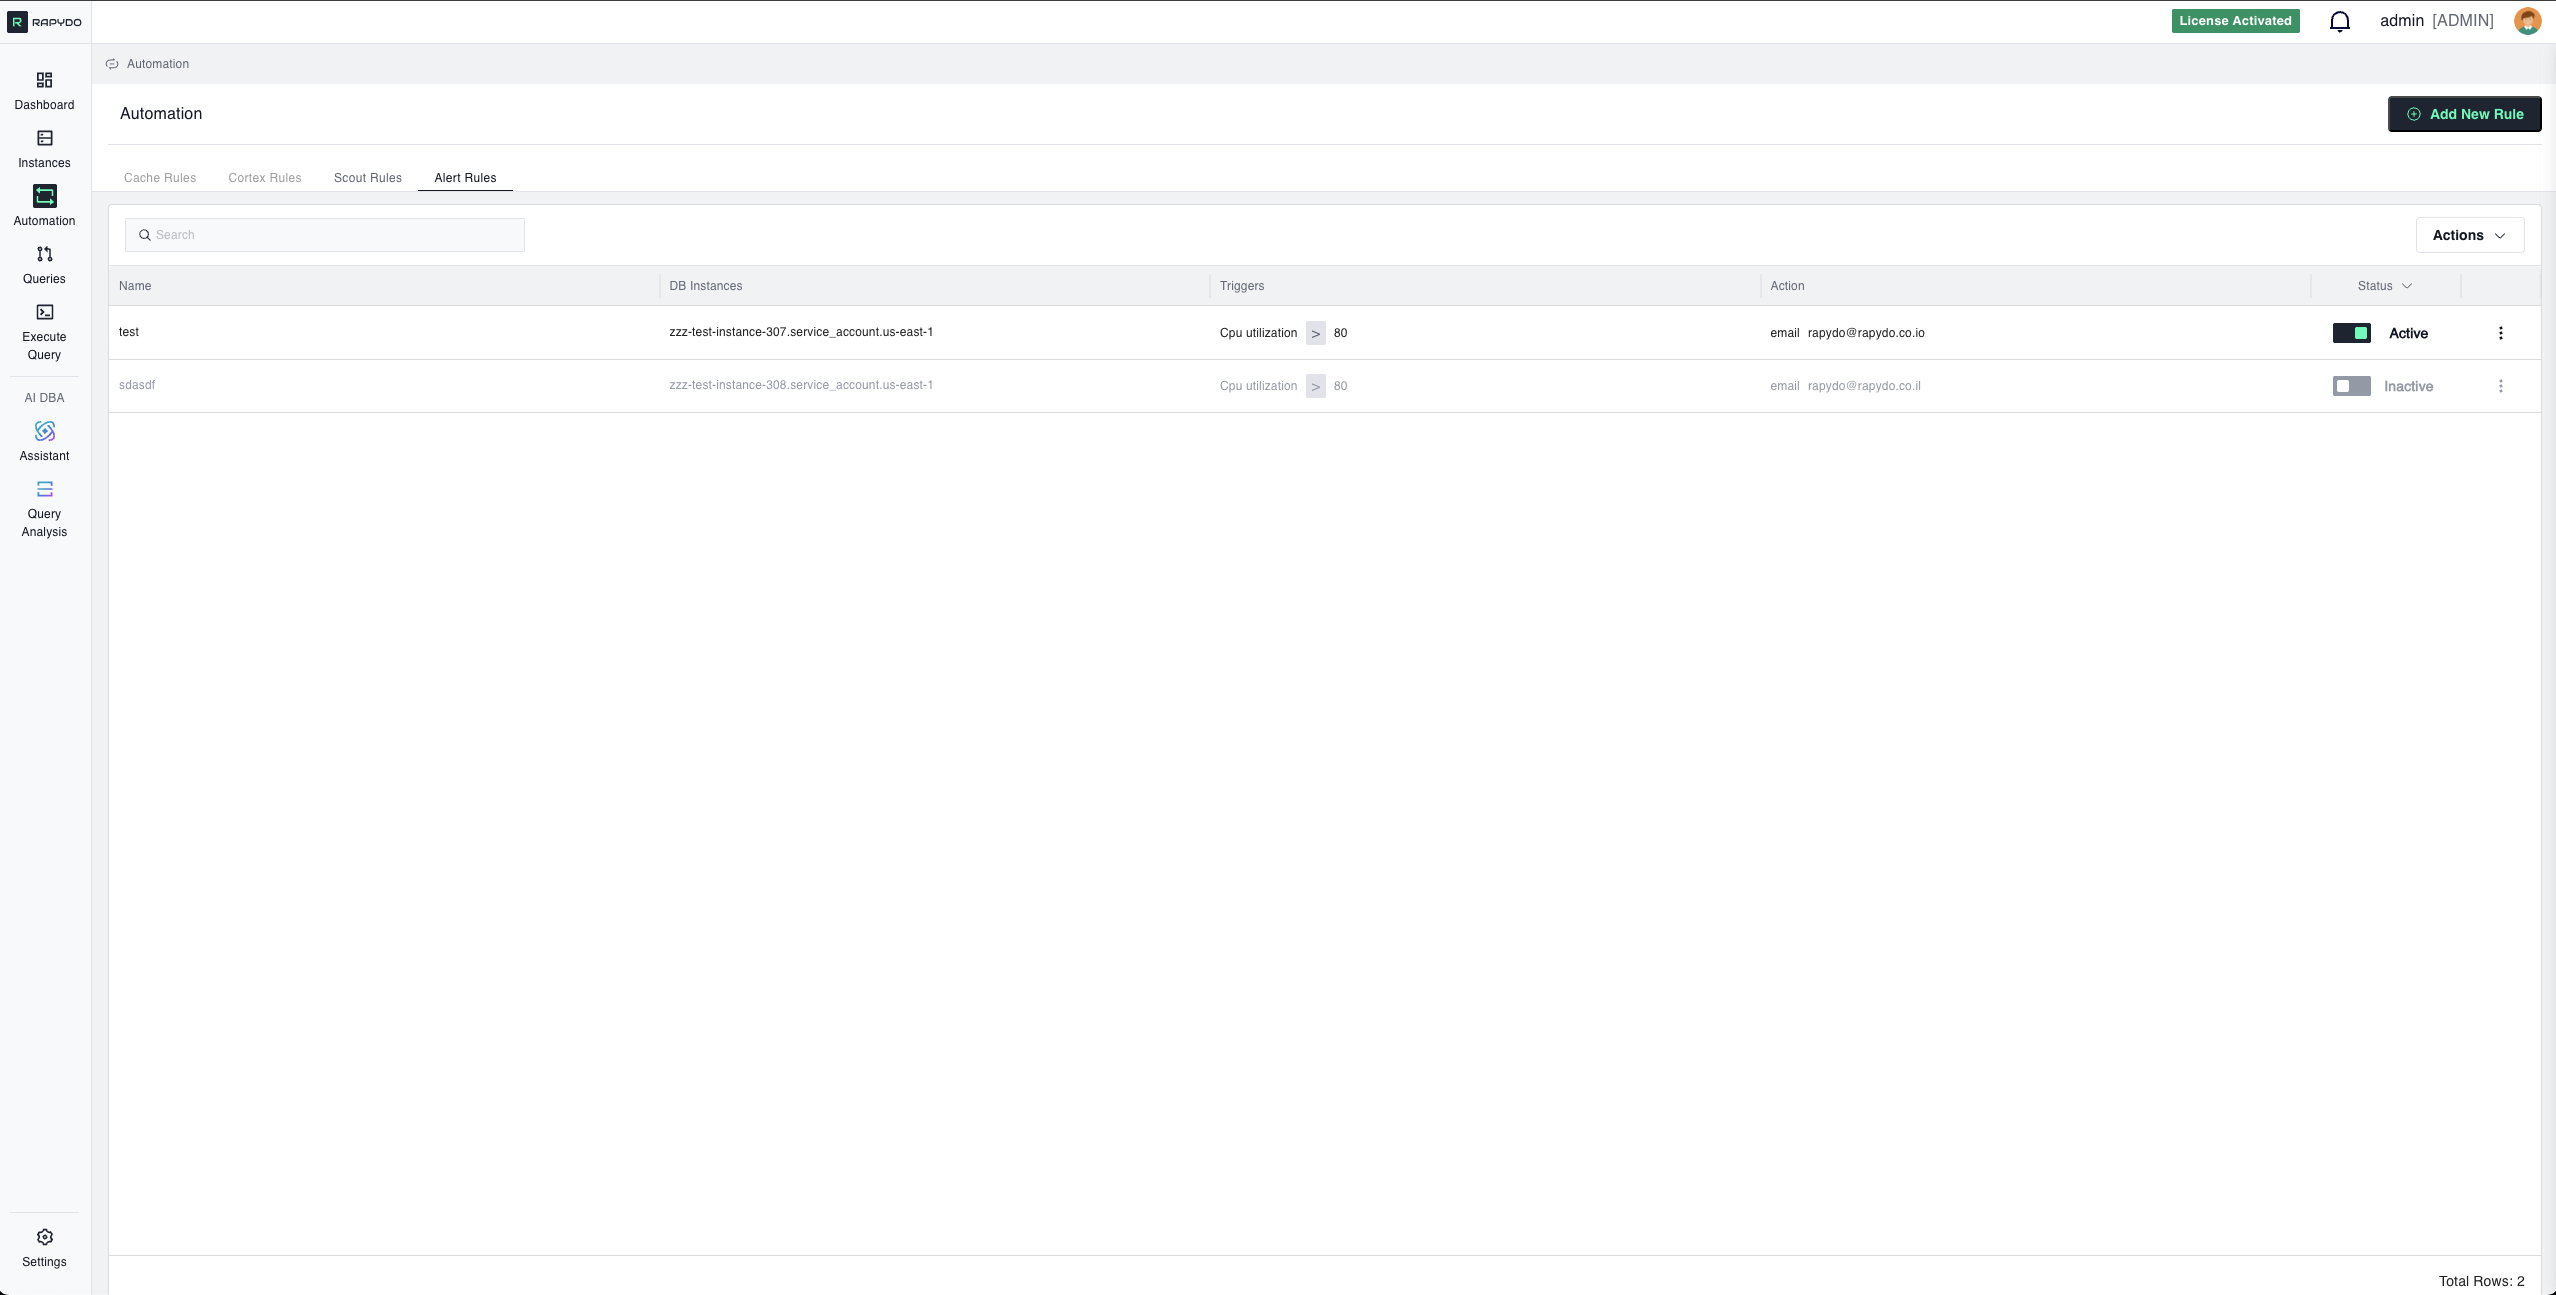 Alert Rules monitor database and system metrics, sending notifications when performance thresholds are exceeded. This guide covers all available metrics, operators, notifications, and configuration parameters.
***
## Core Concepts
Alert Rules monitor database and system metrics, sending notifications when performance thresholds are exceeded. This guide covers all available metrics, operators, notifications, and configuration parameters.
***
## Core Concepts
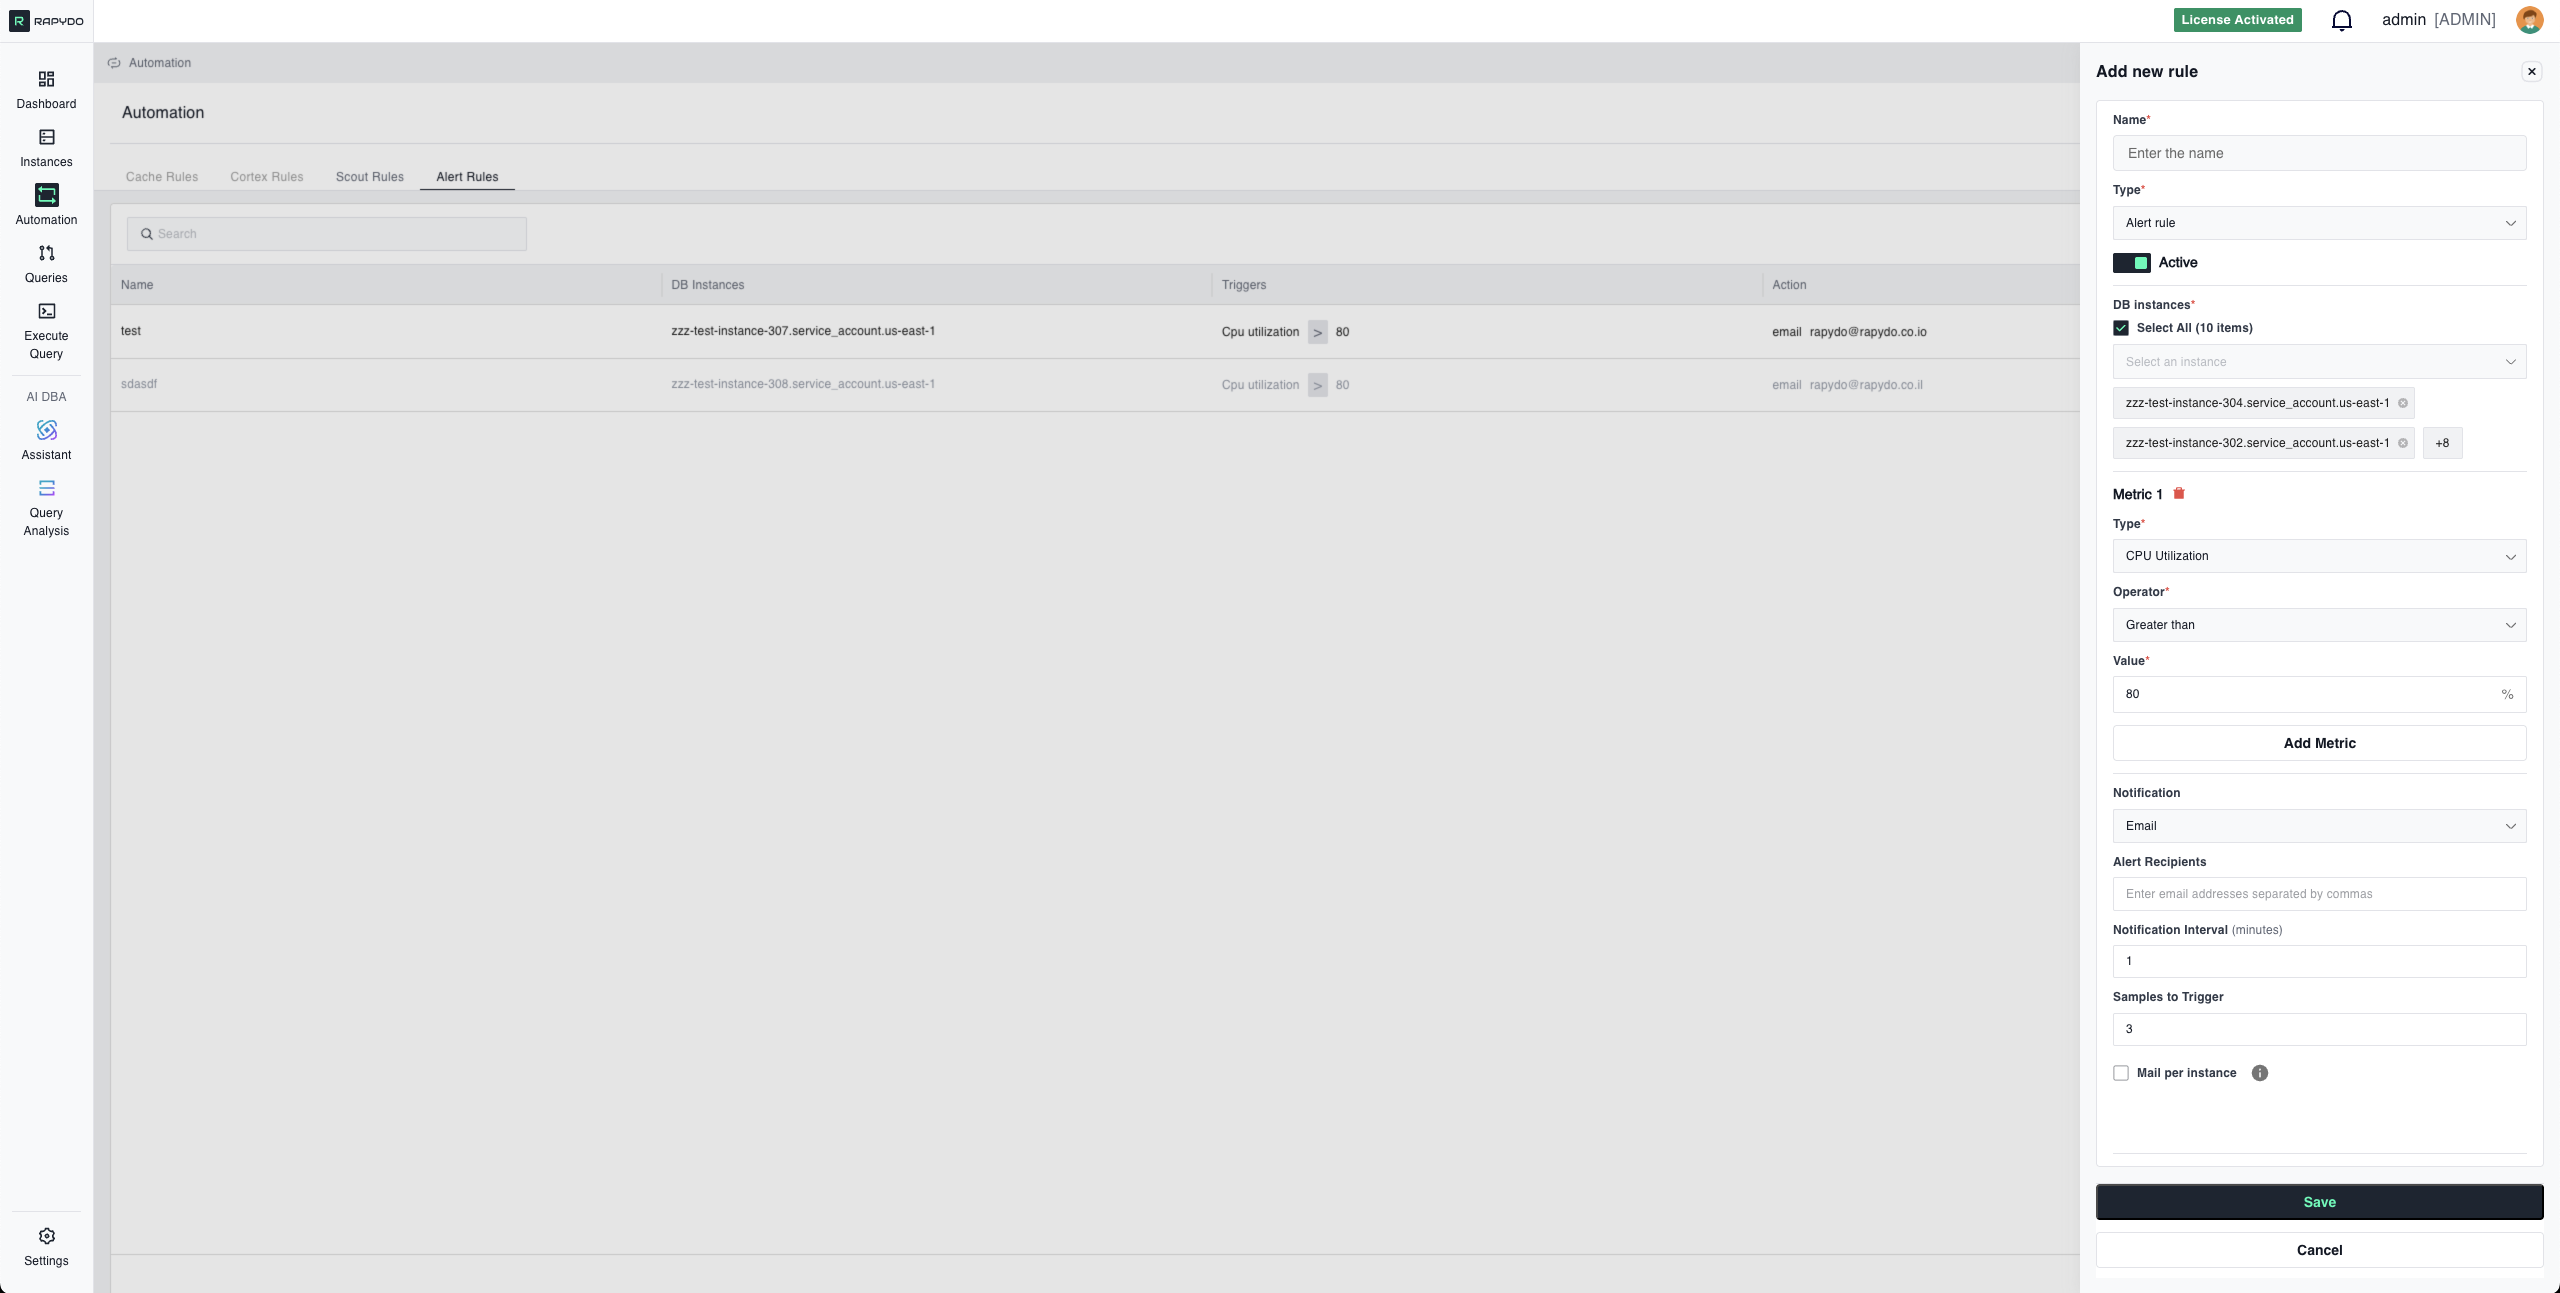 **Metrics** — Conditions defined by you that activate the rule
* Example: CPU Utilization exceeds 90%
* Example: Free Memory drops below 2048 MB
**Notifications** — How you are informed when metric conditions are met
* Example: Send email notification
* Example: Send webhook to a channel
**Select Database(s)** — Choose one or more database instances to apply the rule to
* Select All: Apply to all monitored instances
* Specific Instances: Target individual databases
***
## Available Metric Types
### Resource Utilization
**CPU Utilization**
* Measures processor usage across database instances
* **Unit:** Percentage (%)
* **Use when:** Monitoring compute resource consumption
* **Example:** Alert when CPU > 80%
***
**Free Memory**
* Available RAM on the database instance
* **Unit:** Megabytes (MB)
* **Use when:** Preventing out-of-memory errors
* **Example:** Alert when Free Memory `<` 2048 MB
***
**Read IOPS**
* Input/output operations per second (reads)
* **Unit:** Operations per second
* **Use when:** Monitoring disk read performance
* **Example:** Alert when Read IOPS > 5000
***
**Write IOPS**
* Input/output operations per second (writes)
* **Unit:** Operations per second
* **Use when:** Monitoring disk write performance
* **Example:** Alert when Write IOPS > 3000
***
### Query Performance
**Max Query Duration**
* Duration of the longest-running query
* **Unit:** Seconds
* **Use when:** Detecting slow queries impacting performance
* **Example:** Alert when Max Query Duration > 60 seconds
***
### Connection & Activity
**Connections Count**
* Number of active database connections
* **Unit:** Count (integer)
* **Use when:** Monitoring connection usage
* **Example:** Alert when Connections Count > 200
***
**Connection Utilization**
* Percentage of maximum connections in use
* **Unit:** Percentage (%)
* **Use when:** Preventing connection pool exhaustion
* **Example:** Alert when Connection Utilization > 90%
***
**DB Count**
* Number of database schemas on the instance
* **Unit:** Count (integer)
* **Use when:** Detecting unexpected database creation/deletion
* **Example:** Alert when DB Count > 10
***
**Users Count**
* Number of unique users connected to the database
* **Unit:** Count (integer)
* **Use when:** Monitoring user activity patterns
* **Example:** Alert when Users Count > 50
***
**Hosts Count**
* Number of unique client hosts with connections
* **Unit:** Count (integer)
* **Use when:** Detecting unusual connection sources
* **Example:** Alert when Hosts Count > 100
***
**Waits Count**
* Number of queries currently in wait state
* **Unit:** Count (integer)
* **Use when:** Detecting blocking or resource contention
* **Example:** Alert when Waits Count > 20
***
## Metric Operators
Use operators to define threshold conditions for your metrics:
**Greater than**
* Symbol: `>`
* Alert when metric exceeds the threshold
* Example: `CPU Utilization > 80%`
**Greater than or equal**
* Symbol: `>=`
* Alert when metric meets or exceeds the threshold
* Example: `CPU Utilization >= 80%`
**Less than**
* Symbol: `<`
* Alert when metric falls below the threshold
* Example: `Free Memory < 2048 MB`
**Less than or equal**
* Symbol: `<=`
* Alert when metric meets or falls below the threshold
* Example: `Free Memory <= 2048 MB`
***
## Notification Methods
### Email
* Send email notification to specified recipients
* **Configuration:**
* **Recipients:** List of email addresses (comma-separated)
* **Subject:** Auto-generated based on trigger
* **Content:** Metric values, threshold, timestamp, instance details
* **Mail per instance:** Toggle to control how alerts are grouped
* **Checked:** A separate email is sent for each database that triggers the alert
* **Unchecked:** A single summary email covers all triggered databases
**Example:**
```
Recipients: dba-team@company.com, ops-alerts@company.com
Mail per instance: Enabled
```
***
### Webhook
* Send HTTP POST request to configured webhook URL
* **Configuration:**
* **Webhook Destinations:** Select from configured webhooks (Settings → Webhook)
* **Payload:** JSON containing alert details
**Common Integrations:**
* Slack (via Incoming Webhooks)
* Microsoft Teams (via Incoming Webhook connector)
* PagerDuty (via Events API)
* Custom alerting systems
**Setup:**
1. Go to Settings → Webhook
2. Configure your webhook URL
3. Test the connection
4. Select the webhook when creating Alert Rules
**Example Payload:**
```json theme={null}
{
"alert_type": "Alert Rule",
"rule_name": "High CPU Alert",
"metric": "CPU Utilization",
"current_value": 92,
"threshold": 80,
"operator": "greater_than",
"instance": "production-db-01",
"timestamp": "2024-03-01T14:30:00Z"
}
```
***
## Configuration Parameters
### Samples to Trigger
Number of consecutive checks that must exceed the threshold before alerting.
**Purpose:** Prevents false alerts from temporary spikes
**Example:**
```
Samples to Trigger: 5
Metric: CPU Utilization > 80%
Check 1: 85% ✓ (1/5)
Check 2: 88% ✓ (2/5)
Check 3: 75% ✗ (reset to 0/5)
Check 4: 90% ✓ (1/5)
Check 5: 92% ✓ (2/5)
...
```
**Recommended values:**
* **Volatile metrics (CPU, IOPS):** 4-5 samples
* **Critical failures (Connection Utilization):** 1-2 samples
* **Gradual changes (Memory):** 3-4 samples
***
### Notification Interval
Minimum time (in minutes) between repeated alerts for the same condition.
**Purpose:** Prevents alert flooding while keeping you informed
**Example:**
```
Notification Interval: 3 minutes
Condition: CPU still > 80%
Minute 0: Alert sent 🚨
Minute 3: Alert sent 🚨 (3 min passed)
Minute 6: Alert sent 🚨 (3 min passed)
```
**Recommended values:**
* **Critical alerts:** 3-5 minutes
* **Warning alerts:** 15-30 minutes
* **Informational alerts:** 60+ minutes
***
## Multi-Metric Rules (AND Logic)
Combine multiple metrics to create sophisticated monitoring conditions. All specified conditions must be true simultaneously for the rule to trigger.
### How AND Logic Works
When you add multiple metrics to a single Alert Rule, the rule only triggers when **ALL conditions are met at the same time**.
**Example - High CPU AND High Connections:**
```
Metric 1: CPU Utilization > 85%
AND
Metric 2: Connections Count > 200
```
**Result:** Alert is sent only when:
* ✅ CPU is above 85% **AND**
* ✅ Connections exceed 200 **at the same time**
If only one condition is true, no alert is sent.
***
### Why Use Multi-Metric Rules?
**Reduce False Positives**
Single metrics can trigger during normal operations. Combining metrics creates high-confidence alerts.
**Example:**
* High CPU alone might be normal during batch jobs
* High Connections alone might be normal during peak hours
* High CPU + High Connections together suggests a real performance issue
***
**Identify Specific Scenarios**
Multi-metric rules let you target exact situations that matter.
**Examples:**
**Performance Degradation:**
```
Metric 1: Max Query Duration > 30 seconds
AND
Metric 2: Waits Count > 50
```
→ Alerts when slow queries correlate with blocking/contention
***
**Resource Saturation:**
```
Metric 1: CPU Utilization > 85%
AND
Metric 2: Connection Utilization > 80%
```
→ Alerts when both compute and connection resources are strained
***
**Memory Pressure with High Activity:**
```
Metric 1: Free Memory < 2048 MB
AND
Metric 2: Connections Count > 150
```
→ Alerts when low memory occurs during high connection load
***
### Best Practices for Multi-Metric Rules
✅ **Combine 2-3 metrics** for balance between specificity and maintainability
✅ **Use complementary metrics** that indicate the same underlying issue from different angles
✅ **Test each metric individually first** to understand their behavior before combining
✅ **Avoid too many metrics** - 4+ conditions can make rules too specific and miss real issues
❌ **Don't combine unrelated metrics** - CPU + DB Count makes little sense
***
## Configuration Examples
### Example 1: High CPU Alert (Single Metric)
**Scenario:** Alert when CPU remains elevated
**Configuration:**
```
Type: Alert Rule
Status: Active
DB Instances: Select All
Metric 1:
Type: CPU Utilization
Operator: Greater than
Value: 80%
Samples to Trigger: 5
Notification: Webhook
Webhook Destination: #database-ops
Notification Interval: 3 minutes
```
**Result:** Alerts via webhook after 5 consecutive checks of CPU > 80%, repeats every 3 minutes while condition persists
***
### Example 2: Low Memory Warning (Single Metric)
**Configuration:**
```
Type: Alert Rule
Status: Active
DB Instances: production-db-01, production-db-02
Metric 1:
Type: Free Memory
Operator: Less than
Value: 2048 MB
Samples to Trigger: 3
Notification: Email
Email Recipients: dba-team@company.com
Notification Interval: 5 minutes
```
***
### Example 3: Connection Pool Saturation (Single Metric)
**Configuration:**
```
Type: Alert Rule
Status: Active
Metric 1:
Type: Connection Utilization
Operator: Greater than
Value: 90%
Samples to Trigger: 2
Notification: Webhook
Webhook Destination: #database-ops
Notification Interval: 10 minutes
```
***
### Example 4: Performance Degradation (Multi-Metric)
**Configuration:**
```
Type: Alert Rule
Status: Active
Metric 1:
Type: Max Query Duration
Operator: Greater than
Value: 30 seconds
AND
Metric 2:
Type: Waits Count
Operator: Greater than
Value: 50
Samples to Trigger: 3
Notification: Email
Email Recipients: dba-team@company.com
Notification Interval: 5 minutes
```
**Result:** Alerts when slow queries correlate with high wait states for 3 consecutive checks, suggesting blocking or resource contention
***
### Example 5: Resource Saturation (Multi-Metric)
**Configuration:**
```
Type: Alert Rule
Status: Active
Metric 1:
Type: CPU Utilization
Operator: Greater than
Value: 85%
AND
Metric 2:
Type: Connection Utilization
Operator: Greater than
Value: 80%
Samples to Trigger: 4
Notification: Webhook
Webhook Destination: #critical-alerts
Notification Interval: 3 minutes
```
**Result:** Only alerts when both CPU and connection pool are under pressure simultaneously
***
## Best Practices
✅ **Use appropriate Samples to Trigger values** to avoid false positives from transient spikes
✅ **Set Notification Intervals** that balance awareness with alert fatigue
✅ **Combine metrics with AND logic** to create high-confidence alerts and reduce false positives
✅ **Test rules in non-production** before deploying to critical instances
✅ **Use webhook for team channels** (Slack, Teams) and **email for individual recipients** — each rule supports one notification method
✅ **Review and adjust thresholds** based on actual workload patterns
✅ **Start with single-metric rules** and add additional metrics as you understand your environment
***
## Troubleshooting
### Alert Not Triggering
**Check:**
* Samples to Trigger count is reasonable for your metric check frequency
* Thresholds are appropriate for actual metric values
* For multi-metric rules, verify **ALL** conditions are being met simultaneously
* Rule status is Active, not Disabled
* Selected databases are correct
***
### Too Many Alerts
**Solutions:**
* Increase Samples to Trigger to require sustained issues
* Increase thresholds to appropriate levels
* Extend Notification Interval to reduce frequency
* **Add additional metrics with AND logic** to make the rule more specific
***
### Alerts Stop After First Notification
**Check:**
* Notification Interval is set (not too high)
* Rule is still Active
* Condition is still met (metric hasn't dropped below threshold)
* For multi-metric rules, all conditions are still true
***
### Multi-Metric Rule Never Triggers
**Check:**
* Monitor each metric individually to see if they align timing-wise
* Conditions might not occur simultaneously - consider if they should be separate rules
* Thresholds might be too strict when combined
***
## What's Next?
* [Defining Rules](/automation/defining_rules) - Step-by-step guide to creating rules
* [Scout Rules Reference](/automation/scout_triggers_and_actions) - Complete Scout Rules documentation
* [Automation Overview](/automation/introduction) - Return to automation overview
**Metrics** — Conditions defined by you that activate the rule
* Example: CPU Utilization exceeds 90%
* Example: Free Memory drops below 2048 MB
**Notifications** — How you are informed when metric conditions are met
* Example: Send email notification
* Example: Send webhook to a channel
**Select Database(s)** — Choose one or more database instances to apply the rule to
* Select All: Apply to all monitored instances
* Specific Instances: Target individual databases
***
## Available Metric Types
### Resource Utilization
**CPU Utilization**
* Measures processor usage across database instances
* **Unit:** Percentage (%)
* **Use when:** Monitoring compute resource consumption
* **Example:** Alert when CPU > 80%
***
**Free Memory**
* Available RAM on the database instance
* **Unit:** Megabytes (MB)
* **Use when:** Preventing out-of-memory errors
* **Example:** Alert when Free Memory `<` 2048 MB
***
**Read IOPS**
* Input/output operations per second (reads)
* **Unit:** Operations per second
* **Use when:** Monitoring disk read performance
* **Example:** Alert when Read IOPS > 5000
***
**Write IOPS**
* Input/output operations per second (writes)
* **Unit:** Operations per second
* **Use when:** Monitoring disk write performance
* **Example:** Alert when Write IOPS > 3000
***
### Query Performance
**Max Query Duration**
* Duration of the longest-running query
* **Unit:** Seconds
* **Use when:** Detecting slow queries impacting performance
* **Example:** Alert when Max Query Duration > 60 seconds
***
### Connection & Activity
**Connections Count**
* Number of active database connections
* **Unit:** Count (integer)
* **Use when:** Monitoring connection usage
* **Example:** Alert when Connections Count > 200
***
**Connection Utilization**
* Percentage of maximum connections in use
* **Unit:** Percentage (%)
* **Use when:** Preventing connection pool exhaustion
* **Example:** Alert when Connection Utilization > 90%
***
**DB Count**
* Number of database schemas on the instance
* **Unit:** Count (integer)
* **Use when:** Detecting unexpected database creation/deletion
* **Example:** Alert when DB Count > 10
***
**Users Count**
* Number of unique users connected to the database
* **Unit:** Count (integer)
* **Use when:** Monitoring user activity patterns
* **Example:** Alert when Users Count > 50
***
**Hosts Count**
* Number of unique client hosts with connections
* **Unit:** Count (integer)
* **Use when:** Detecting unusual connection sources
* **Example:** Alert when Hosts Count > 100
***
**Waits Count**
* Number of queries currently in wait state
* **Unit:** Count (integer)
* **Use when:** Detecting blocking or resource contention
* **Example:** Alert when Waits Count > 20
***
## Metric Operators
Use operators to define threshold conditions for your metrics:
**Greater than**
* Symbol: `>`
* Alert when metric exceeds the threshold
* Example: `CPU Utilization > 80%`
**Greater than or equal**
* Symbol: `>=`
* Alert when metric meets or exceeds the threshold
* Example: `CPU Utilization >= 80%`
**Less than**
* Symbol: `<`
* Alert when metric falls below the threshold
* Example: `Free Memory < 2048 MB`
**Less than or equal**
* Symbol: `<=`
* Alert when metric meets or falls below the threshold
* Example: `Free Memory <= 2048 MB`
***
## Notification Methods
### Email
* Send email notification to specified recipients
* **Configuration:**
* **Recipients:** List of email addresses (comma-separated)
* **Subject:** Auto-generated based on trigger
* **Content:** Metric values, threshold, timestamp, instance details
* **Mail per instance:** Toggle to control how alerts are grouped
* **Checked:** A separate email is sent for each database that triggers the alert
* **Unchecked:** A single summary email covers all triggered databases
**Example:**
```
Recipients: dba-team@company.com, ops-alerts@company.com
Mail per instance: Enabled
```
***
### Webhook
* Send HTTP POST request to configured webhook URL
* **Configuration:**
* **Webhook Destinations:** Select from configured webhooks (Settings → Webhook)
* **Payload:** JSON containing alert details
**Common Integrations:**
* Slack (via Incoming Webhooks)
* Microsoft Teams (via Incoming Webhook connector)
* PagerDuty (via Events API)
* Custom alerting systems
**Setup:**
1. Go to Settings → Webhook
2. Configure your webhook URL
3. Test the connection
4. Select the webhook when creating Alert Rules
**Example Payload:**
```json theme={null}
{
"alert_type": "Alert Rule",
"rule_name": "High CPU Alert",
"metric": "CPU Utilization",
"current_value": 92,
"threshold": 80,
"operator": "greater_than",
"instance": "production-db-01",
"timestamp": "2024-03-01T14:30:00Z"
}
```
***
## Configuration Parameters
### Samples to Trigger
Number of consecutive checks that must exceed the threshold before alerting.
**Purpose:** Prevents false alerts from temporary spikes
**Example:**
```
Samples to Trigger: 5
Metric: CPU Utilization > 80%
Check 1: 85% ✓ (1/5)
Check 2: 88% ✓ (2/5)
Check 3: 75% ✗ (reset to 0/5)
Check 4: 90% ✓ (1/5)
Check 5: 92% ✓ (2/5)
...
```
**Recommended values:**
* **Volatile metrics (CPU, IOPS):** 4-5 samples
* **Critical failures (Connection Utilization):** 1-2 samples
* **Gradual changes (Memory):** 3-4 samples
***
### Notification Interval
Minimum time (in minutes) between repeated alerts for the same condition.
**Purpose:** Prevents alert flooding while keeping you informed
**Example:**
```
Notification Interval: 3 minutes
Condition: CPU still > 80%
Minute 0: Alert sent 🚨
Minute 3: Alert sent 🚨 (3 min passed)
Minute 6: Alert sent 🚨 (3 min passed)
```
**Recommended values:**
* **Critical alerts:** 3-5 minutes
* **Warning alerts:** 15-30 minutes
* **Informational alerts:** 60+ minutes
***
## Multi-Metric Rules (AND Logic)
Combine multiple metrics to create sophisticated monitoring conditions. All specified conditions must be true simultaneously for the rule to trigger.
### How AND Logic Works
When you add multiple metrics to a single Alert Rule, the rule only triggers when **ALL conditions are met at the same time**.
**Example - High CPU AND High Connections:**
```
Metric 1: CPU Utilization > 85%
AND
Metric 2: Connections Count > 200
```
**Result:** Alert is sent only when:
* ✅ CPU is above 85% **AND**
* ✅ Connections exceed 200 **at the same time**
If only one condition is true, no alert is sent.
***
### Why Use Multi-Metric Rules?
**Reduce False Positives**
Single metrics can trigger during normal operations. Combining metrics creates high-confidence alerts.
**Example:**
* High CPU alone might be normal during batch jobs
* High Connections alone might be normal during peak hours
* High CPU + High Connections together suggests a real performance issue
***
**Identify Specific Scenarios**
Multi-metric rules let you target exact situations that matter.
**Examples:**
**Performance Degradation:**
```
Metric 1: Max Query Duration > 30 seconds
AND
Metric 2: Waits Count > 50
```
→ Alerts when slow queries correlate with blocking/contention
***
**Resource Saturation:**
```
Metric 1: CPU Utilization > 85%
AND
Metric 2: Connection Utilization > 80%
```
→ Alerts when both compute and connection resources are strained
***
**Memory Pressure with High Activity:**
```
Metric 1: Free Memory < 2048 MB
AND
Metric 2: Connections Count > 150
```
→ Alerts when low memory occurs during high connection load
***
### Best Practices for Multi-Metric Rules
✅ **Combine 2-3 metrics** for balance between specificity and maintainability
✅ **Use complementary metrics** that indicate the same underlying issue from different angles
✅ **Test each metric individually first** to understand their behavior before combining
✅ **Avoid too many metrics** - 4+ conditions can make rules too specific and miss real issues
❌ **Don't combine unrelated metrics** - CPU + DB Count makes little sense
***
## Configuration Examples
### Example 1: High CPU Alert (Single Metric)
**Scenario:** Alert when CPU remains elevated
**Configuration:**
```
Type: Alert Rule
Status: Active
DB Instances: Select All
Metric 1:
Type: CPU Utilization
Operator: Greater than
Value: 80%
Samples to Trigger: 5
Notification: Webhook
Webhook Destination: #database-ops
Notification Interval: 3 minutes
```
**Result:** Alerts via webhook after 5 consecutive checks of CPU > 80%, repeats every 3 minutes while condition persists
***
### Example 2: Low Memory Warning (Single Metric)
**Configuration:**
```
Type: Alert Rule
Status: Active
DB Instances: production-db-01, production-db-02
Metric 1:
Type: Free Memory
Operator: Less than
Value: 2048 MB
Samples to Trigger: 3
Notification: Email
Email Recipients: dba-team@company.com
Notification Interval: 5 minutes
```
***
### Example 3: Connection Pool Saturation (Single Metric)
**Configuration:**
```
Type: Alert Rule
Status: Active
Metric 1:
Type: Connection Utilization
Operator: Greater than
Value: 90%
Samples to Trigger: 2
Notification: Webhook
Webhook Destination: #database-ops
Notification Interval: 10 minutes
```
***
### Example 4: Performance Degradation (Multi-Metric)
**Configuration:**
```
Type: Alert Rule
Status: Active
Metric 1:
Type: Max Query Duration
Operator: Greater than
Value: 30 seconds
AND
Metric 2:
Type: Waits Count
Operator: Greater than
Value: 50
Samples to Trigger: 3
Notification: Email
Email Recipients: dba-team@company.com
Notification Interval: 5 minutes
```
**Result:** Alerts when slow queries correlate with high wait states for 3 consecutive checks, suggesting blocking or resource contention
***
### Example 5: Resource Saturation (Multi-Metric)
**Configuration:**
```
Type: Alert Rule
Status: Active
Metric 1:
Type: CPU Utilization
Operator: Greater than
Value: 85%
AND
Metric 2:
Type: Connection Utilization
Operator: Greater than
Value: 80%
Samples to Trigger: 4
Notification: Webhook
Webhook Destination: #critical-alerts
Notification Interval: 3 minutes
```
**Result:** Only alerts when both CPU and connection pool are under pressure simultaneously
***
## Best Practices
✅ **Use appropriate Samples to Trigger values** to avoid false positives from transient spikes
✅ **Set Notification Intervals** that balance awareness with alert fatigue
✅ **Combine metrics with AND logic** to create high-confidence alerts and reduce false positives
✅ **Test rules in non-production** before deploying to critical instances
✅ **Use webhook for team channels** (Slack, Teams) and **email for individual recipients** — each rule supports one notification method
✅ **Review and adjust thresholds** based on actual workload patterns
✅ **Start with single-metric rules** and add additional metrics as you understand your environment
***
## Troubleshooting
### Alert Not Triggering
**Check:**
* Samples to Trigger count is reasonable for your metric check frequency
* Thresholds are appropriate for actual metric values
* For multi-metric rules, verify **ALL** conditions are being met simultaneously
* Rule status is Active, not Disabled
* Selected databases are correct
***
### Too Many Alerts
**Solutions:**
* Increase Samples to Trigger to require sustained issues
* Increase thresholds to appropriate levels
* Extend Notification Interval to reduce frequency
* **Add additional metrics with AND logic** to make the rule more specific
***
### Alerts Stop After First Notification
**Check:**
* Notification Interval is set (not too high)
* Rule is still Active
* Condition is still met (metric hasn't dropped below threshold)
* For multi-metric rules, all conditions are still true
***
### Multi-Metric Rule Never Triggers
**Check:**
* Monitor each metric individually to see if they align timing-wise
* Conditions might not occur simultaneously - consider if they should be separate rules
* Thresholds might be too strict when combined
***
## What's Next?
* [Defining Rules](/automation/defining_rules) - Step-by-step guide to creating rules
* [Scout Rules Reference](/automation/scout_triggers_and_actions) - Complete Scout Rules documentation
* [Automation Overview](/automation/introduction) - Return to automation overview