> ## Documentation Index
> Fetch the complete documentation index at: https://docs.rapydo.io/llms.txt
> Use this file to discover all available pages before exploring further.
# Query Analysis
> AI-powered query analysis with actionable remediation plans
## Overview
 Query Analysis provides comprehensive, AI-powered investigation of query performance. It connects directly to your database instances to generate execution plans and collect metadata, then uses multiple AI analysts to examine the evidence and deliver:
* **Root cause identification** — Pinpoint exactly why queries are slow
* **Remediation plans** — Step-by-step implementation guidance with ready-to-run SQL
* **Impact estimates** — Understand expected performance improvements before making changes
* **Supporting evidence** — Complete technical details backing every recommendation
***
## Getting Started
Query Analysis provides comprehensive, AI-powered investigation of query performance. It connects directly to your database instances to generate execution plans and collect metadata, then uses multiple AI analysts to examine the evidence and deliver:
* **Root cause identification** — Pinpoint exactly why queries are slow
* **Remediation plans** — Step-by-step implementation guidance with ready-to-run SQL
* **Impact estimates** — Understand expected performance improvements before making changes
* **Supporting evidence** — Complete technical details backing every recommendation
***
## Getting Started
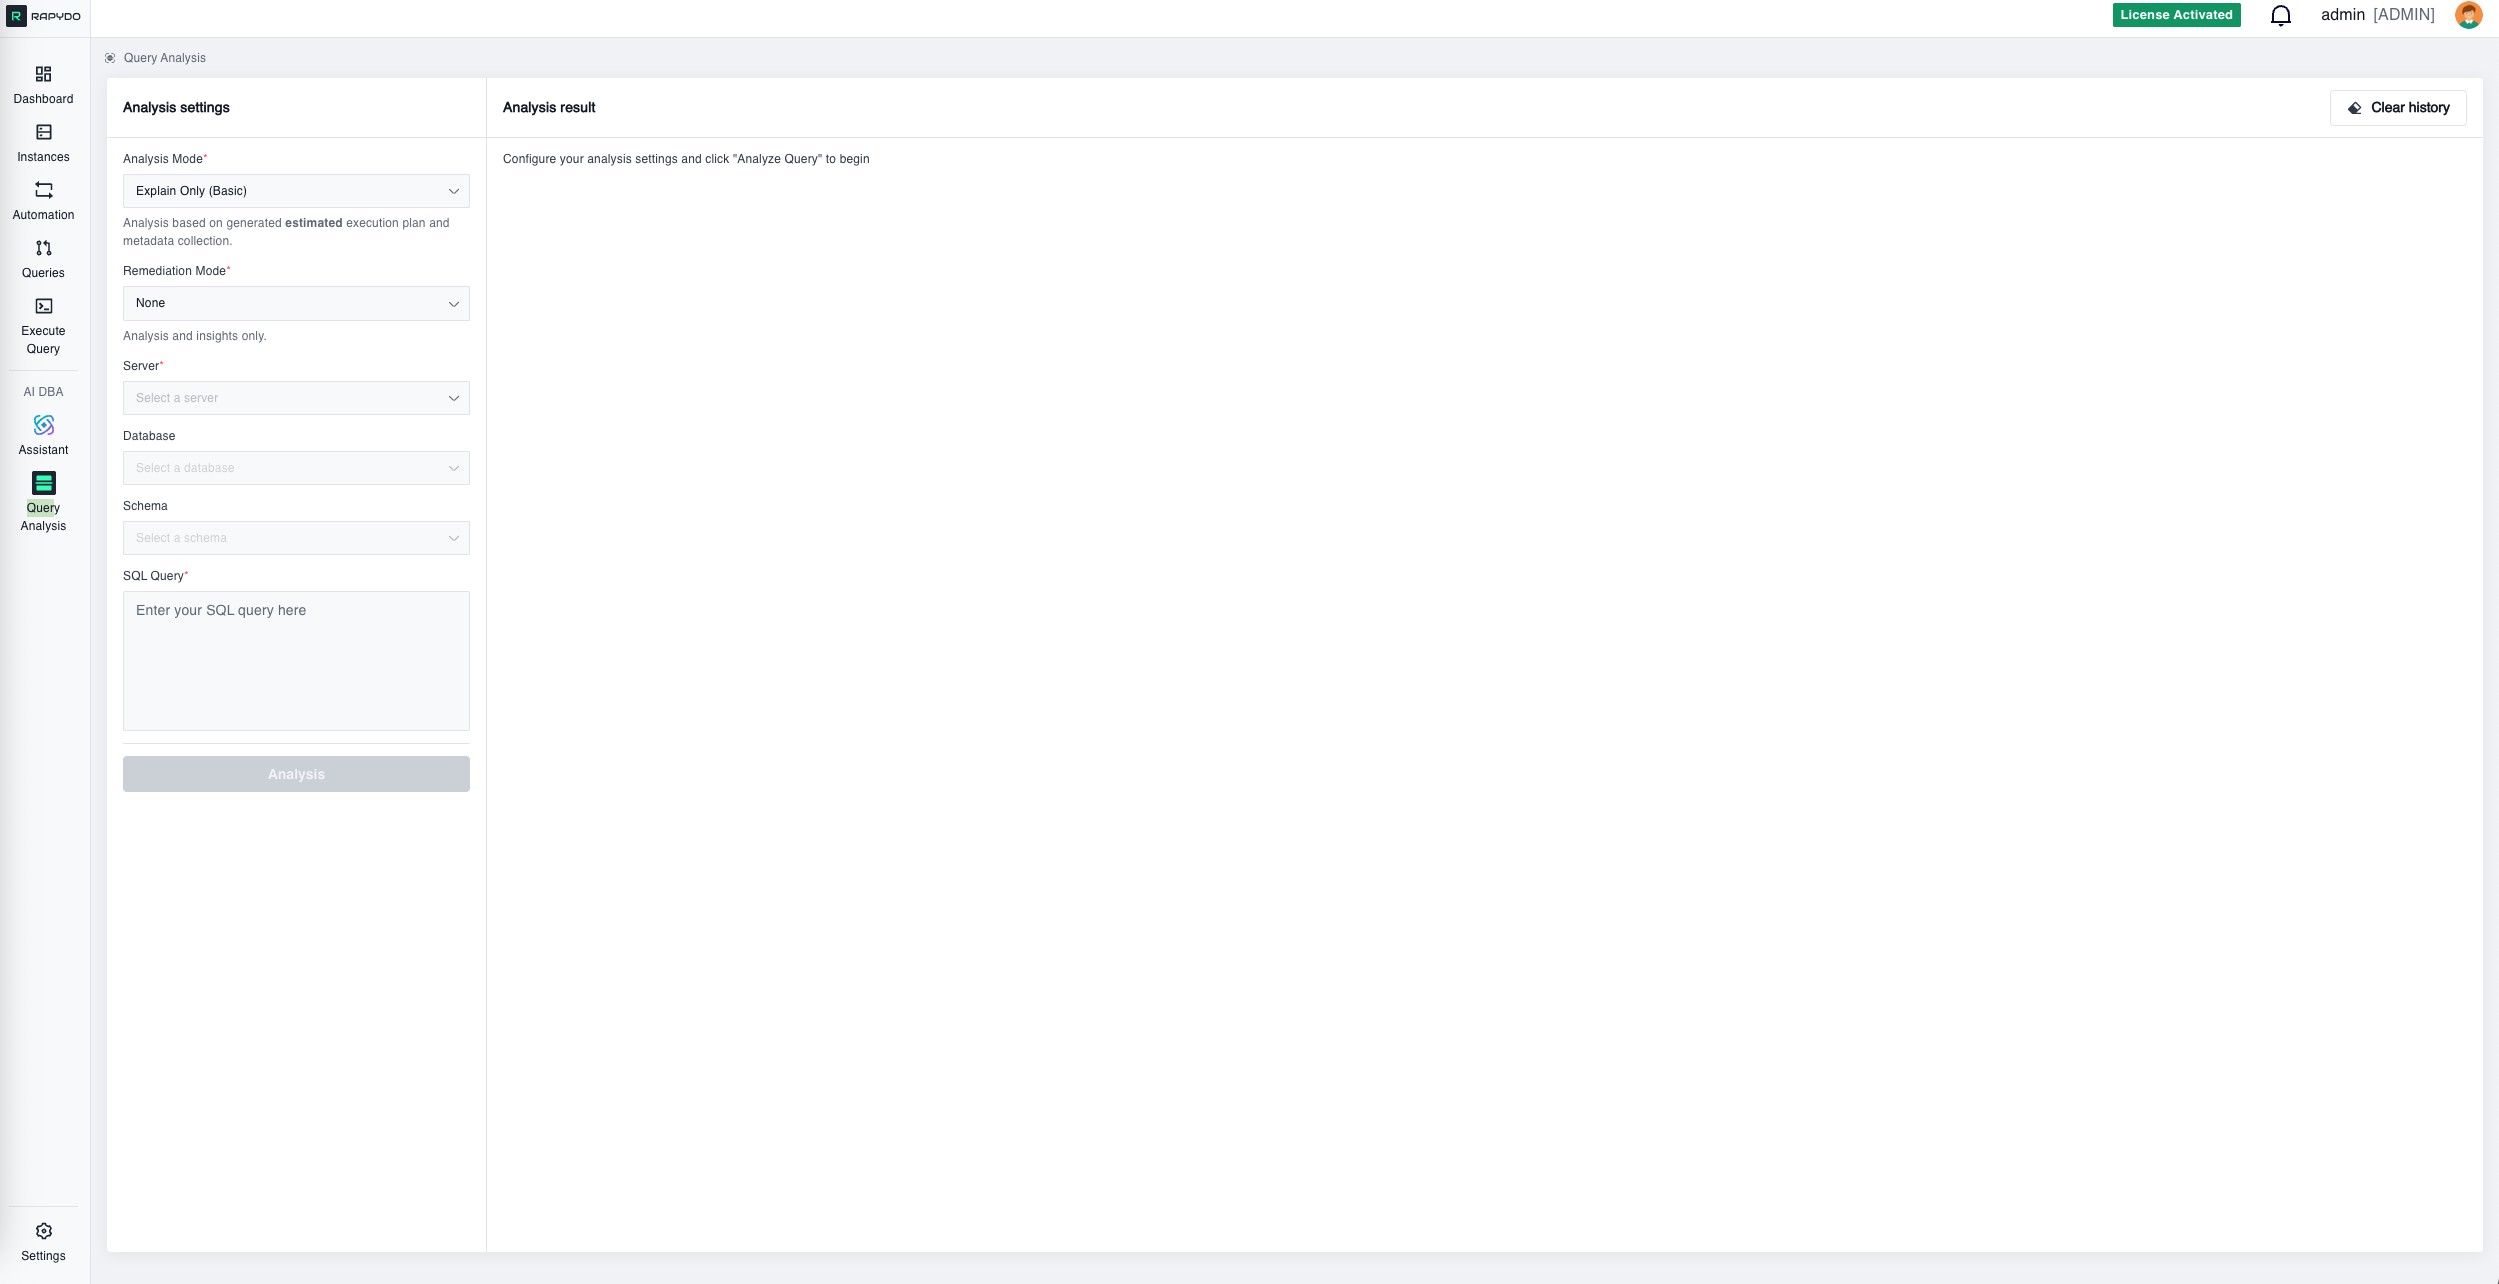
 Access Query Analysis from the left navigation panel under **AI DBA → Query Analysis**.
### Analysis Settings
Configure your analysis with these required fields:
**Analysis Mode** — Select the type of execution plan analysis:
* **Explain Only (Basic)** — Generates an estimated execution plan based on table statistics and metadata. Fast and safe for production use since the query is not actually executed.
* **Explain Analyze (Advanced)** — Actually executes the query and measures real performance metrics. Provides accurate row counts and timing data instead of estimates. Use with caution on production systems as the query will run.
**Server** — Select the database instance to analyze from your monitored fleet.
**Database** — Choose the specific database on that server.
**Schema** — Optionally select a schema to provide additional context. Available for **PostgreSQL only**; this field is disabled for MySQL instances.
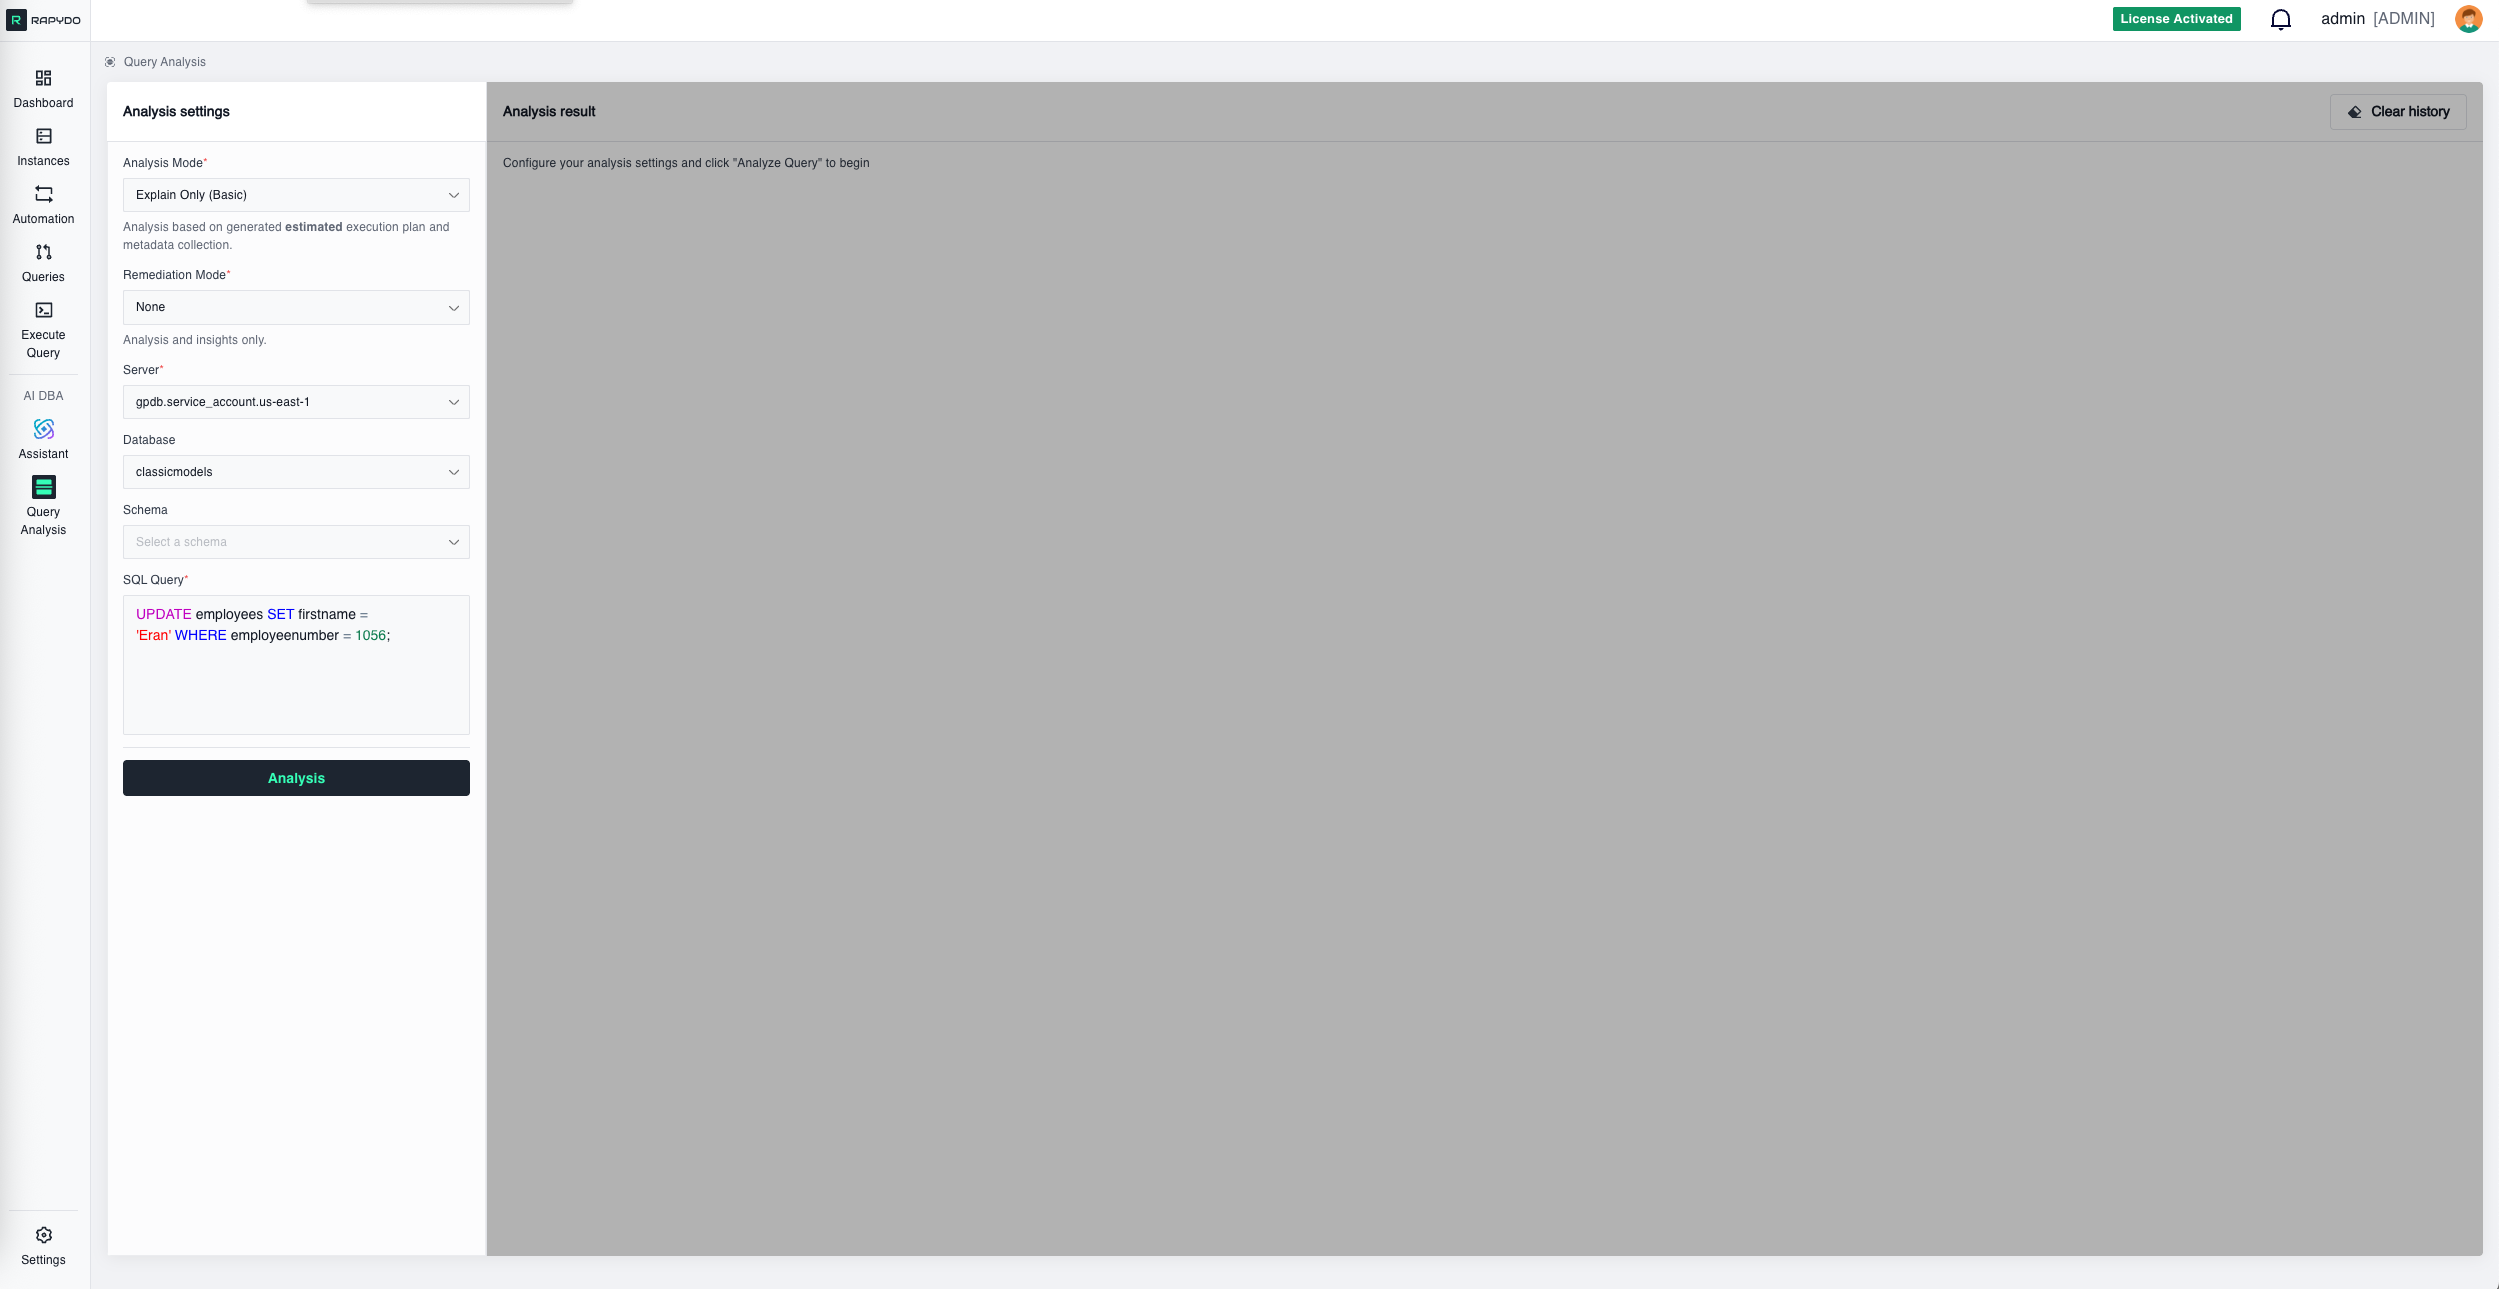
**SQL Query** — Enter or paste the query you want to analyze. The editor provides syntax highlighting for readability.
Click **Analysis** to begin.
***
## Ways to Access Query Analysis
### Direct Entry
Navigate to Query Analysis and manually enter your server, database, and SQL query.
***
### From Query Workspace
When viewing queries in any query workspace (like Process count history or other query lists), hover over any query row to reveal the **Analyze Query** button. Clicking it opens Query Analysis with all required fields automatically populated—server, database, and query are pre-filled and ready for one-click analysis.
***
### From Dashboard
Dashboard widgets like **Longest Query** and **Query Avg Time** display your slowest queries. Each query row includes an **Analyze Query** button that opens Query Analysis with all fields pre-filled for immediate analysis.
***
## Analysis Results
After clicking Analysis, the system connects to your database, generates an execution plan, collects metadata, and runs AI analysis. Results include:
### Analysis Configuration
A summary header showing:
* Server name
* Analysis mode (Explain Only or Explain Analyze)
* Database name
* Timestamp
* The SQL query being analyzed (with syntax highlighting)
***
### Analysis Summary
Access Query Analysis from the left navigation panel under **AI DBA → Query Analysis**.
### Analysis Settings
Configure your analysis with these required fields:
**Analysis Mode** — Select the type of execution plan analysis:
* **Explain Only (Basic)** — Generates an estimated execution plan based on table statistics and metadata. Fast and safe for production use since the query is not actually executed.
* **Explain Analyze (Advanced)** — Actually executes the query and measures real performance metrics. Provides accurate row counts and timing data instead of estimates. Use with caution on production systems as the query will run.
**Server** — Select the database instance to analyze from your monitored fleet.
**Database** — Choose the specific database on that server.
**Schema** — Optionally select a schema to provide additional context. Available for **PostgreSQL only**; this field is disabled for MySQL instances.
**SQL Query** — Enter or paste the query you want to analyze. The editor provides syntax highlighting for readability.
Click **Analysis** to begin.
***
## Ways to Access Query Analysis
### Direct Entry
Navigate to Query Analysis and manually enter your server, database, and SQL query.
***
### From Query Workspace
When viewing queries in any query workspace (like Process count history or other query lists), hover over any query row to reveal the **Analyze Query** button. Clicking it opens Query Analysis with all required fields automatically populated—server, database, and query are pre-filled and ready for one-click analysis.
***
### From Dashboard
Dashboard widgets like **Longest Query** and **Query Avg Time** display your slowest queries. Each query row includes an **Analyze Query** button that opens Query Analysis with all fields pre-filled for immediate analysis.
***
## Analysis Results
After clicking Analysis, the system connects to your database, generates an execution plan, collects metadata, and runs AI analysis. Results include:
### Analysis Configuration
A summary header showing:
* Server name
* Analysis mode (Explain Only or Explain Analyze)
* Database name
* Timestamp
* The SQL query being analyzed (with syntax highlighting)
***
### Analysis Summary
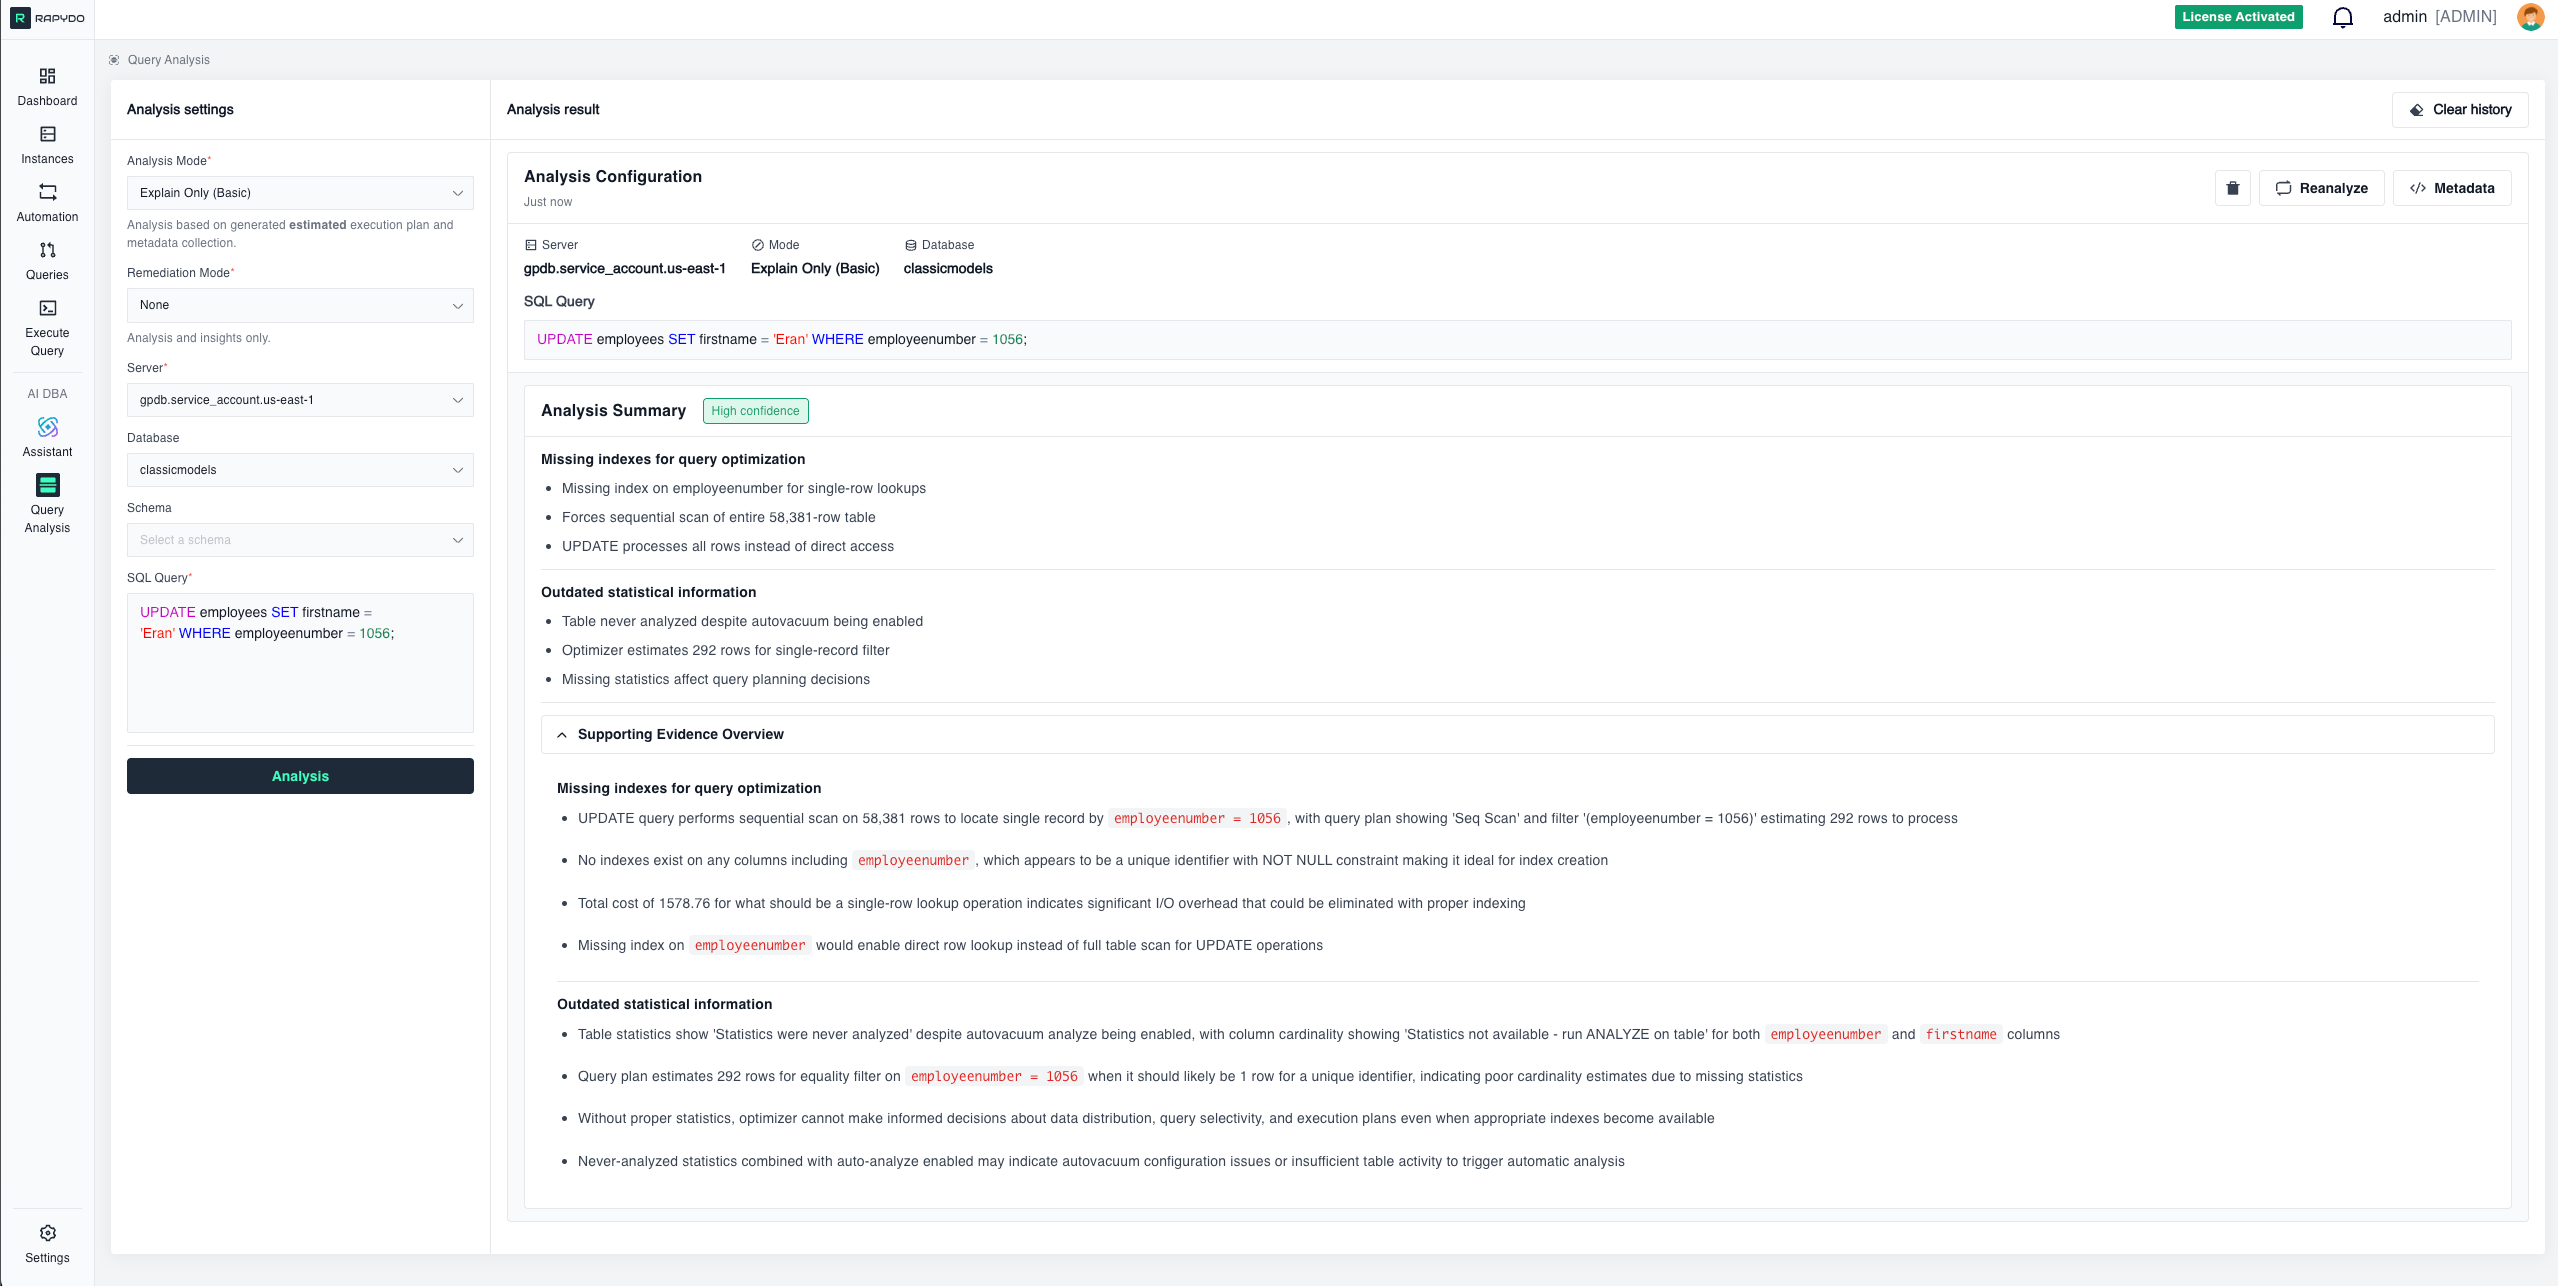 The AI provides a confidence-rated summary of findings. Each issue is clearly explained with context on why it matters and how it impacts performance.
**Example findings:**
**Inefficient per-row function call**
* Using `pg_sleep(4)` creates deliberate 4-second delay per row
* Function dominates performance regardless of other optimizations
* Affects every row processed during query execution
**Missing indexes for query optimization**
* No indexes on join columns `employeeNumber` and `customerNumber`
* Forces expensive nested loops processing billions of combinations
* Sequential scans required for all table access operations
**Under-optimized join order algorithm**
* Processes large tables before applying selective payment filter
* Creates massive intermediate results exploding to billions of rows
* Should start with filtered payments then smallest tables
**Outdated statistical information**
* Employees and payments tables never analyzed despite autovacuum enabled
* Optimizer uses default assumptions creating unrealistic row estimates
* Inconsistent statistics across tables affects join decisions
***
### Remediation Plan
The AI provides a confidence-rated summary of findings. Each issue is clearly explained with context on why it matters and how it impacts performance.
**Example findings:**
**Inefficient per-row function call**
* Using `pg_sleep(4)` creates deliberate 4-second delay per row
* Function dominates performance regardless of other optimizations
* Affects every row processed during query execution
**Missing indexes for query optimization**
* No indexes on join columns `employeeNumber` and `customerNumber`
* Forces expensive nested loops processing billions of combinations
* Sequential scans required for all table access operations
**Under-optimized join order algorithm**
* Processes large tables before applying selective payment filter
* Creates massive intermediate results exploding to billions of rows
* Should start with filtered payments then smallest tables
**Outdated statistical information**
* Employees and payments tables never analyzed despite autovacuum enabled
* Optimizer uses default assumptions creating unrealistic row estimates
* Inconsistent statistics across tables affects join decisions
***
### Remediation Plan
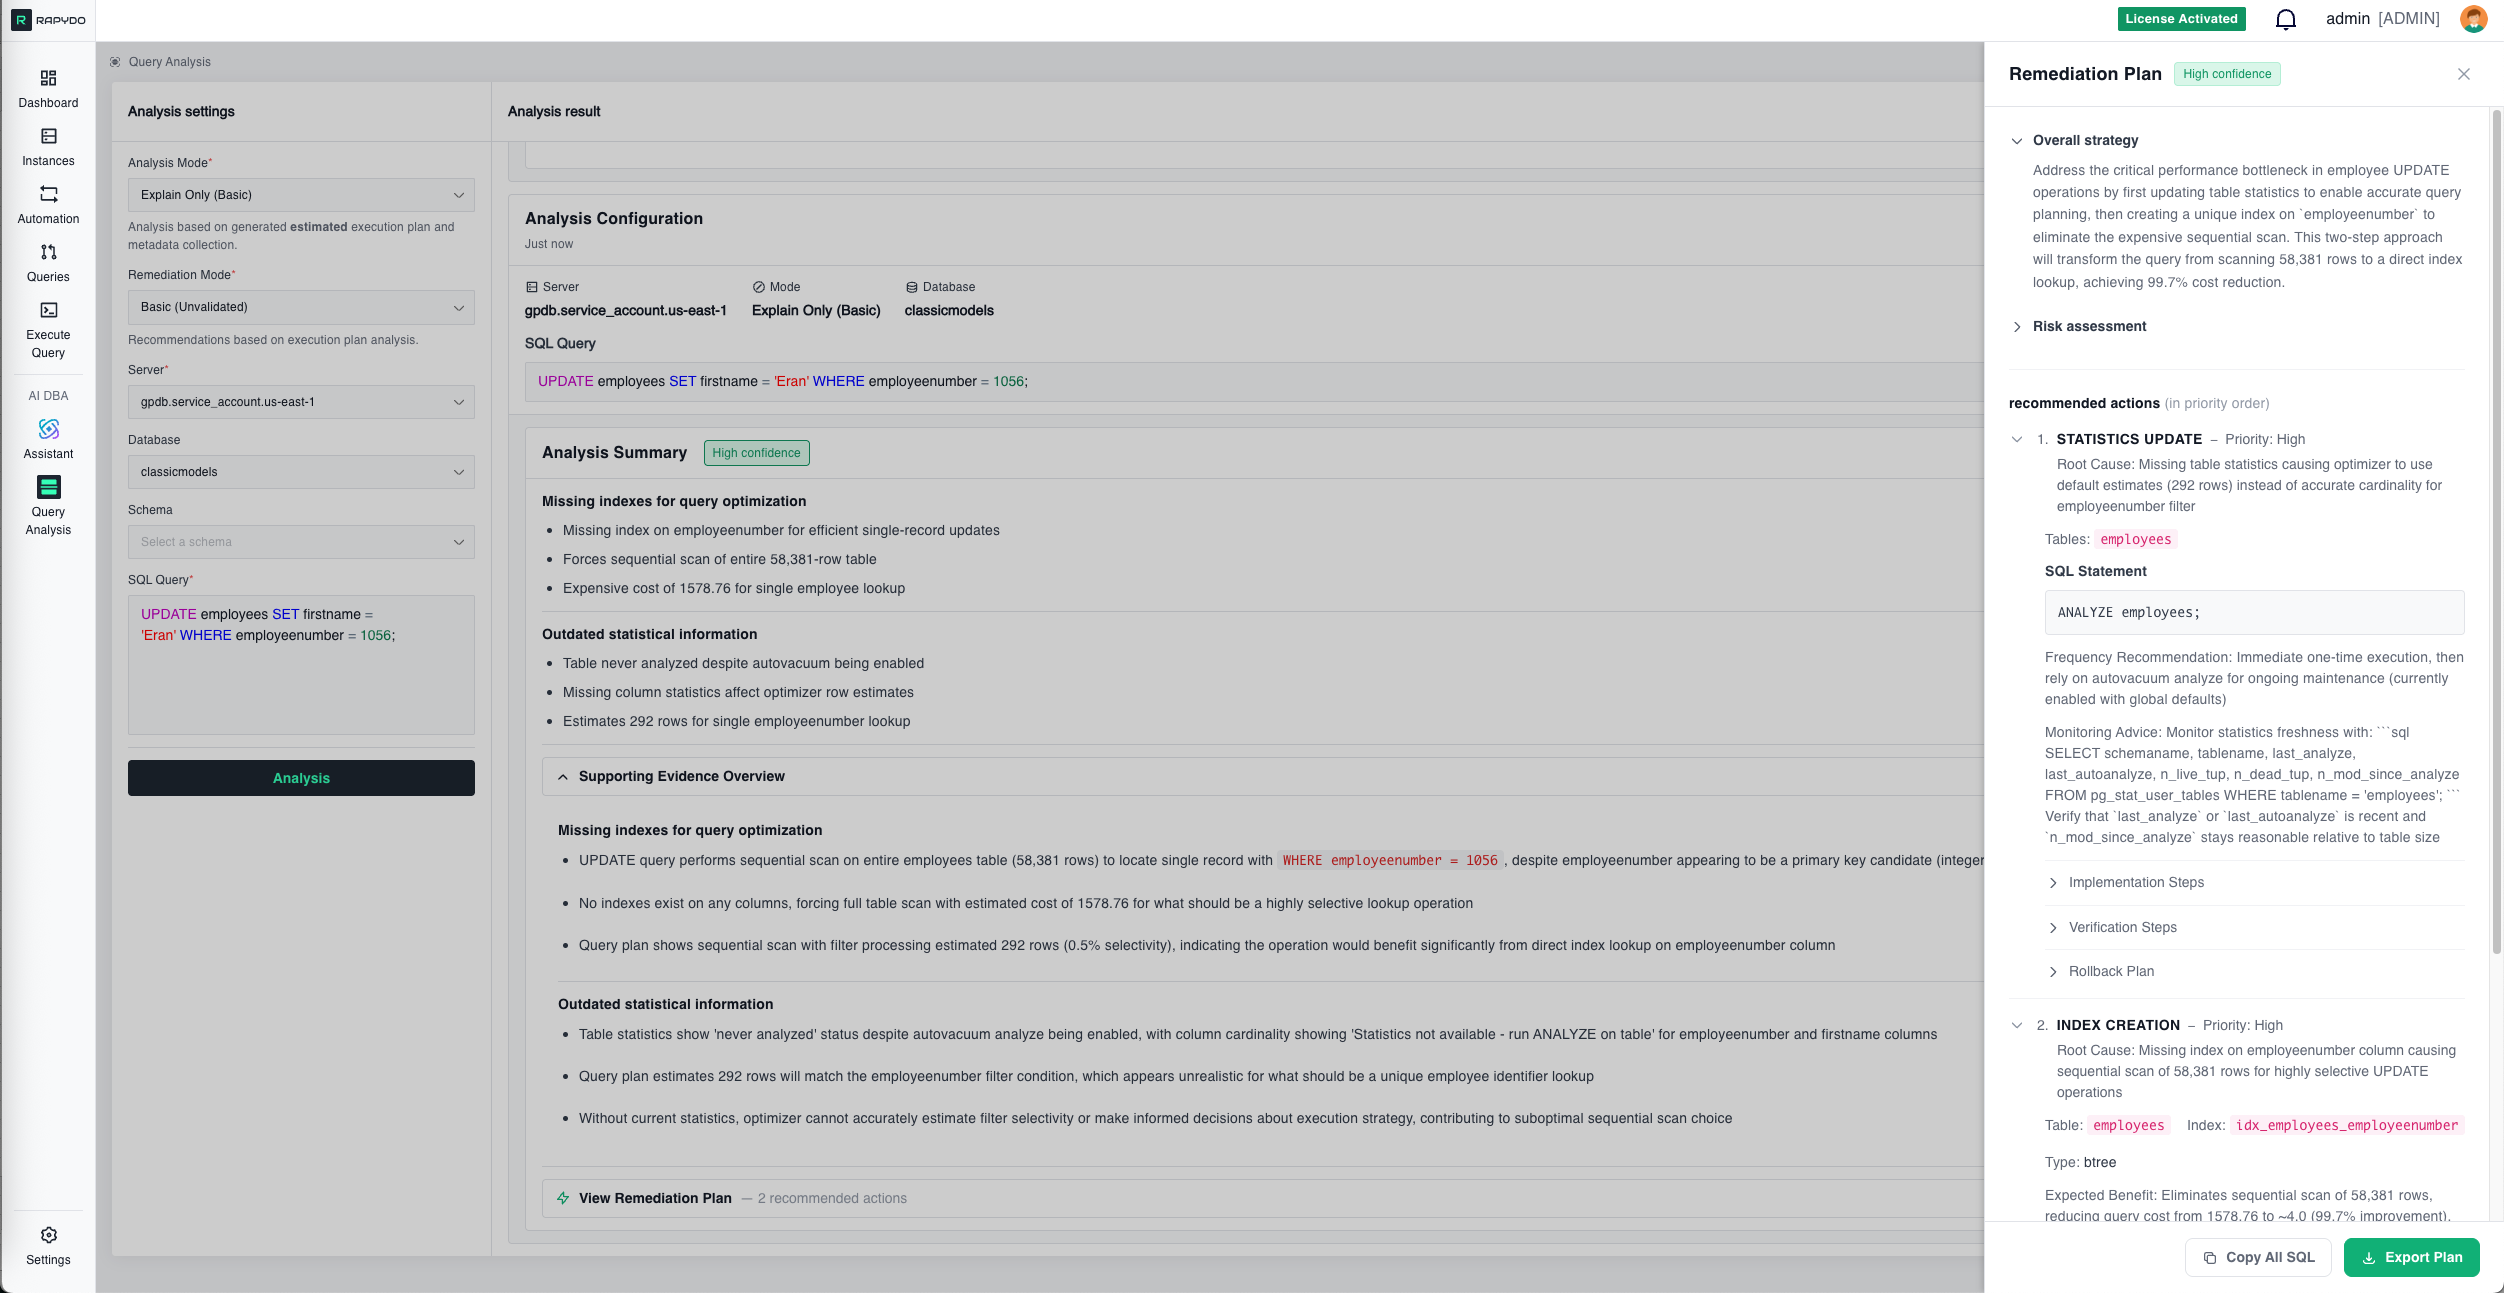 For each identified issue, Query Analysis provides a complete remediation plan with:
#### **Specific Actions**
Clear, prioritized steps to resolve the issue.
#### **Ready-to-Run SQL**
Pre-written SQL statements you can execute immediately:
```sql theme={null}
-- Create missing index on employeeNumber
CREATE INDEX idx_employees_employee_number
ON employees(employeeNumber);
-- Update table statistics
ANALYZE employees;
ANALYZE payments;
```
#### **Estimated Impact**
Expected performance improvements after implementing the fix:
**Example:**
* **Current performance:** Query takes 88 seconds
* **After index creation:** Expected execution time \~2 seconds (98% improvement)
* **After statistics update:** Optimizer will choose more efficient join order
#### **Implementation Guidance**
Important considerations for safely applying the fix:
**Example:**
* Index creation will lock the table briefly (\~10 seconds for 56K rows)
* Recommended to run during low-traffic periods
* Consider using `CREATE INDEX CONCURRENTLY` on PostgreSQL for zero-downtime creation
* Verify index usage with `EXPLAIN` after creation
#### **Priority & Order**
When multiple issues exist, the plan indicates the order to address them:
**Example:**
1. **High Priority:** Create index on `employeeNumber` (biggest impact)
2. **Medium Priority:** Update table statistics (improves optimizer decisions)
3. **Low Priority:** Consider query rewrite (minor optimization)
***
### Supporting Evidence Overview
Detailed technical evidence backing each finding. This section shows exactly what the AI observed in the execution plan and metadata:
**Function Analysis:**
* "Query includes `pg_sleep(4)` function call in SELECT clause, introducing deliberate 4-second delay per row processed"
**Join Analysis with Calculations:**
* "Join condition `e.employeeNumber = c.salesRepEmployeeNumber` forces nested loop with 56,078 × 249,856 row comparisons, creating 3.08 million intermediate results"
**Cost Analysis:**
* "Query plan shows astronomical cost of 2.6 billion units due to nested loop joins processing 6.17 billion estimated row combinations"
**Statistics Status:**
* "Tables employees and payments show 'Statistics were never analyzed' despite having autovacuum analyze enabled"
**Join Order Recommendations:**
* "Optimal approach should start with most selective filtered dataset—payments with 1,503 rows after WHERE amount \< 1000"
***
### Metadata Panel
For each identified issue, Query Analysis provides a complete remediation plan with:
#### **Specific Actions**
Clear, prioritized steps to resolve the issue.
#### **Ready-to-Run SQL**
Pre-written SQL statements you can execute immediately:
```sql theme={null}
-- Create missing index on employeeNumber
CREATE INDEX idx_employees_employee_number
ON employees(employeeNumber);
-- Update table statistics
ANALYZE employees;
ANALYZE payments;
```
#### **Estimated Impact**
Expected performance improvements after implementing the fix:
**Example:**
* **Current performance:** Query takes 88 seconds
* **After index creation:** Expected execution time \~2 seconds (98% improvement)
* **After statistics update:** Optimizer will choose more efficient join order
#### **Implementation Guidance**
Important considerations for safely applying the fix:
**Example:**
* Index creation will lock the table briefly (\~10 seconds for 56K rows)
* Recommended to run during low-traffic periods
* Consider using `CREATE INDEX CONCURRENTLY` on PostgreSQL for zero-downtime creation
* Verify index usage with `EXPLAIN` after creation
#### **Priority & Order**
When multiple issues exist, the plan indicates the order to address them:
**Example:**
1. **High Priority:** Create index on `employeeNumber` (biggest impact)
2. **Medium Priority:** Update table statistics (improves optimizer decisions)
3. **Low Priority:** Consider query rewrite (minor optimization)
***
### Supporting Evidence Overview
Detailed technical evidence backing each finding. This section shows exactly what the AI observed in the execution plan and metadata:
**Function Analysis:**
* "Query includes `pg_sleep(4)` function call in SELECT clause, introducing deliberate 4-second delay per row processed"
**Join Analysis with Calculations:**
* "Join condition `e.employeeNumber = c.salesRepEmployeeNumber` forces nested loop with 56,078 × 249,856 row comparisons, creating 3.08 million intermediate results"
**Cost Analysis:**
* "Query plan shows astronomical cost of 2.6 billion units due to nested loop joins processing 6.17 billion estimated row combinations"
**Statistics Status:**
* "Tables employees and payments show 'Statistics were never analyzed' despite having autovacuum analyze enabled"
**Join Order Recommendations:**
* "Optimal approach should start with most selective filtered dataset—payments with 1,503 rows after WHERE amount \< 1000"
***
### Metadata Panel
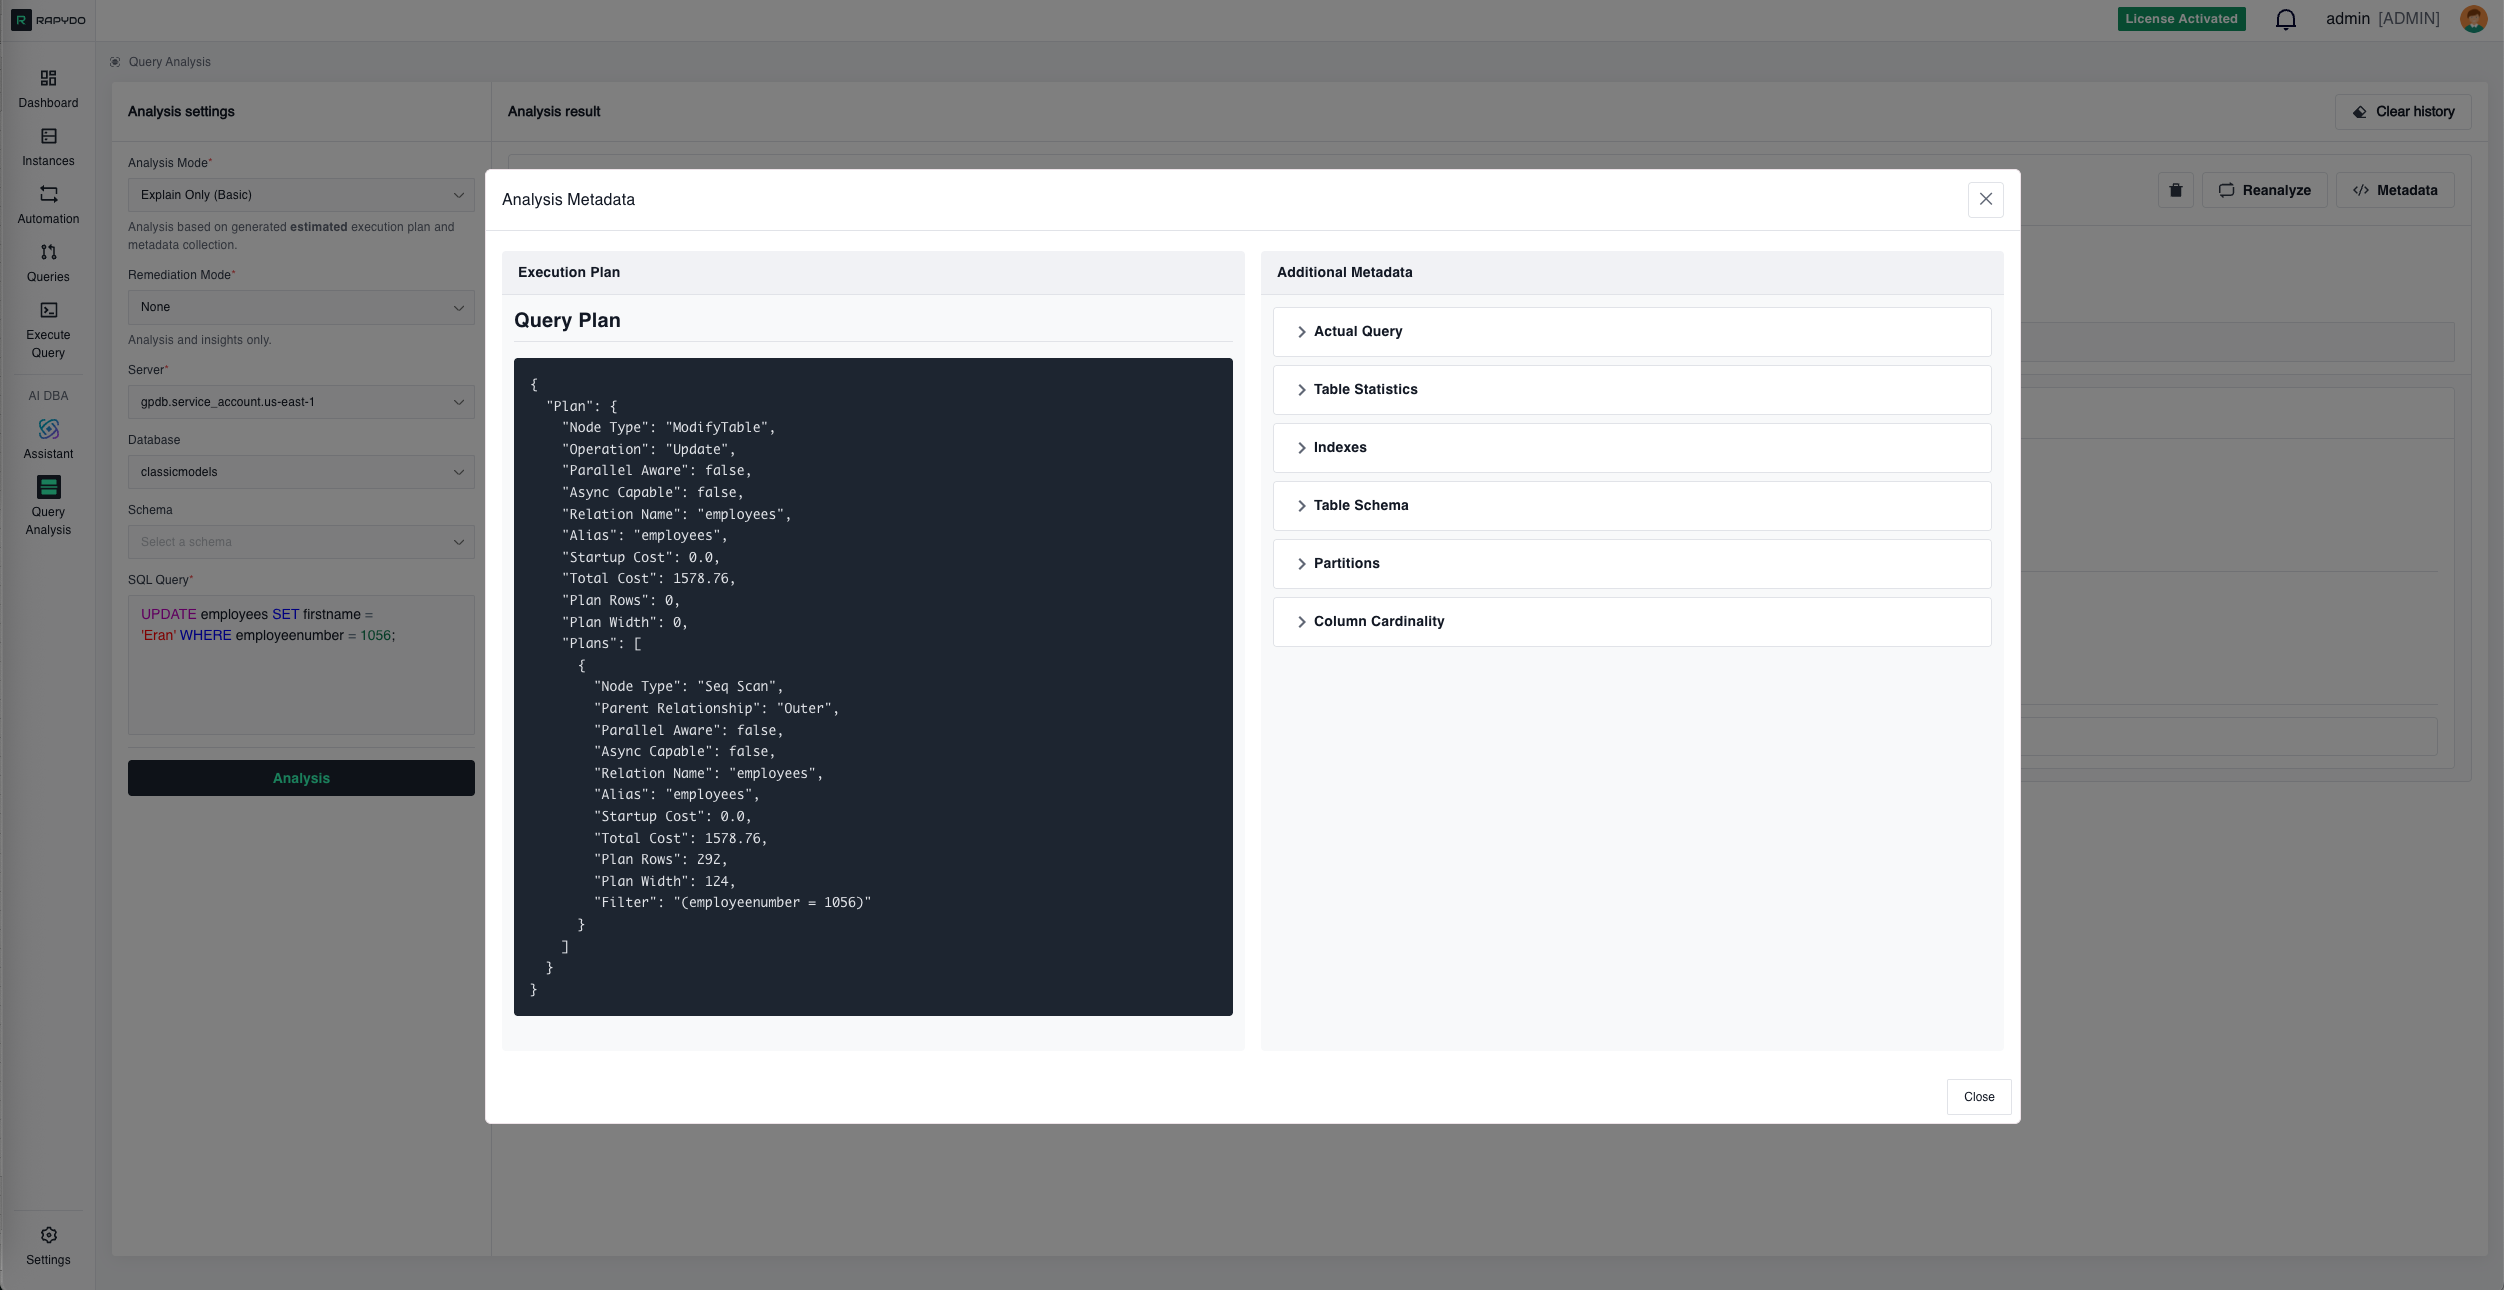 Click **Metadata** to view the raw technical details:
**Execution Plan**
The complete JSON execution plan from the database, showing:
* Node types (Sequential Scan, Index Scan, Nested Loop, etc.)
* Cost estimates (startup cost, total cost)
* Row estimates vs. actual rows (when using Explain Analyze)
* Filter conditions and join predicates
***
**Query Metadata**
Additional context including:
**Table Statistics:**
* Row counts
* Last analyze timestamp
* Last vacuum timestamp
* Statistics age
**Indexes:**
* Existing indexes on affected tables
* Index definitions (columns, type, conditions)
* Or confirmation that no indexes exist
**Table Schema:**
* Column definitions with data types
* Constraints (PRIMARY KEY, FOREIGN KEY, UNIQUE, NOT NULL)
* Default values
**Partitions:**
* Partition status for each table
* Partition strategy (RANGE, LIST, HASH)
* Partition boundaries
**Column Cardinality:**
* Distinct value counts (n\_distinct)
* Null percentages
* Average column width
* Correlation coefficient
* Histogram availability
***
## Key Features
### Confidence Ratings
Each analysis includes a confidence indicator (e.g., "High confidence") showing how certain the AI is about its findings based on the available evidence.
**Confidence levels:**
* **High:** Strong evidence from execution plan and metadata
* **Medium:** Reasonable inference based on available data
* **Low:** Suggestion that requires verification
***
### Multiple Analysis Perspectives
The AI examines queries from several angles simultaneously:
* **Execution efficiency** — Scan types, join algorithms, row estimates
* **Index utilization** — Missing indexes, unused indexes, index suggestions
* **Statistics freshness** — Outdated statistics, missing statistics
* **Schema design** — Join patterns, data types, constraints
***
### Actionable Output
Findings are presented as specific, actionable items rather than generic advice:
❌ **Generic:** "Consider adding an index"
✅ **Specific:** "Create index on `employees(employeeNumber)` — Expected 98% performance improvement"
❌ **Generic:** "Query is slow"
✅ **Specific:** "Nested loop processing 3.08M row combinations due to missing index on join column"
***
### Results Panel Controls
Each analysis result in the panel has the following controls:
* **Delete** (trash icon) — Removes that specific analysis from the results panel
* **Reanalyze** — Opens the **Reanalyze settings** dialog, pre-filled with the original query and settings, to run a fresh analysis
* **Metadata** — Opens the raw metadata viewer (execution plan, table statistics, indexes, schema)
* **Clear history** (top of results panel) — Removes all analyses from the panel at once
***
### Reanalyze
Click **Metadata** to view the raw technical details:
**Execution Plan**
The complete JSON execution plan from the database, showing:
* Node types (Sequential Scan, Index Scan, Nested Loop, etc.)
* Cost estimates (startup cost, total cost)
* Row estimates vs. actual rows (when using Explain Analyze)
* Filter conditions and join predicates
***
**Query Metadata**
Additional context including:
**Table Statistics:**
* Row counts
* Last analyze timestamp
* Last vacuum timestamp
* Statistics age
**Indexes:**
* Existing indexes on affected tables
* Index definitions (columns, type, conditions)
* Or confirmation that no indexes exist
**Table Schema:**
* Column definitions with data types
* Constraints (PRIMARY KEY, FOREIGN KEY, UNIQUE, NOT NULL)
* Default values
**Partitions:**
* Partition status for each table
* Partition strategy (RANGE, LIST, HASH)
* Partition boundaries
**Column Cardinality:**
* Distinct value counts (n\_distinct)
* Null percentages
* Average column width
* Correlation coefficient
* Histogram availability
***
## Key Features
### Confidence Ratings
Each analysis includes a confidence indicator (e.g., "High confidence") showing how certain the AI is about its findings based on the available evidence.
**Confidence levels:**
* **High:** Strong evidence from execution plan and metadata
* **Medium:** Reasonable inference based on available data
* **Low:** Suggestion that requires verification
***
### Multiple Analysis Perspectives
The AI examines queries from several angles simultaneously:
* **Execution efficiency** — Scan types, join algorithms, row estimates
* **Index utilization** — Missing indexes, unused indexes, index suggestions
* **Statistics freshness** — Outdated statistics, missing statistics
* **Schema design** — Join patterns, data types, constraints
***
### Actionable Output
Findings are presented as specific, actionable items rather than generic advice:
❌ **Generic:** "Consider adding an index"
✅ **Specific:** "Create index on `employees(employeeNumber)` — Expected 98% performance improvement"
❌ **Generic:** "Query is slow"
✅ **Specific:** "Nested loop processing 3.08M row combinations due to missing index on join column"
***
### Results Panel Controls
Each analysis result in the panel has the following controls:
* **Delete** (trash icon) — Removes that specific analysis from the results panel
* **Reanalyze** — Opens the **Reanalyze settings** dialog, pre-filled with the original query and settings, to run a fresh analysis
* **Metadata** — Opens the raw metadata viewer (execution plan, table statistics, indexes, schema)
* **Clear history** (top of results panel) — Removes all analyses from the panel at once
***
### Reanalyze
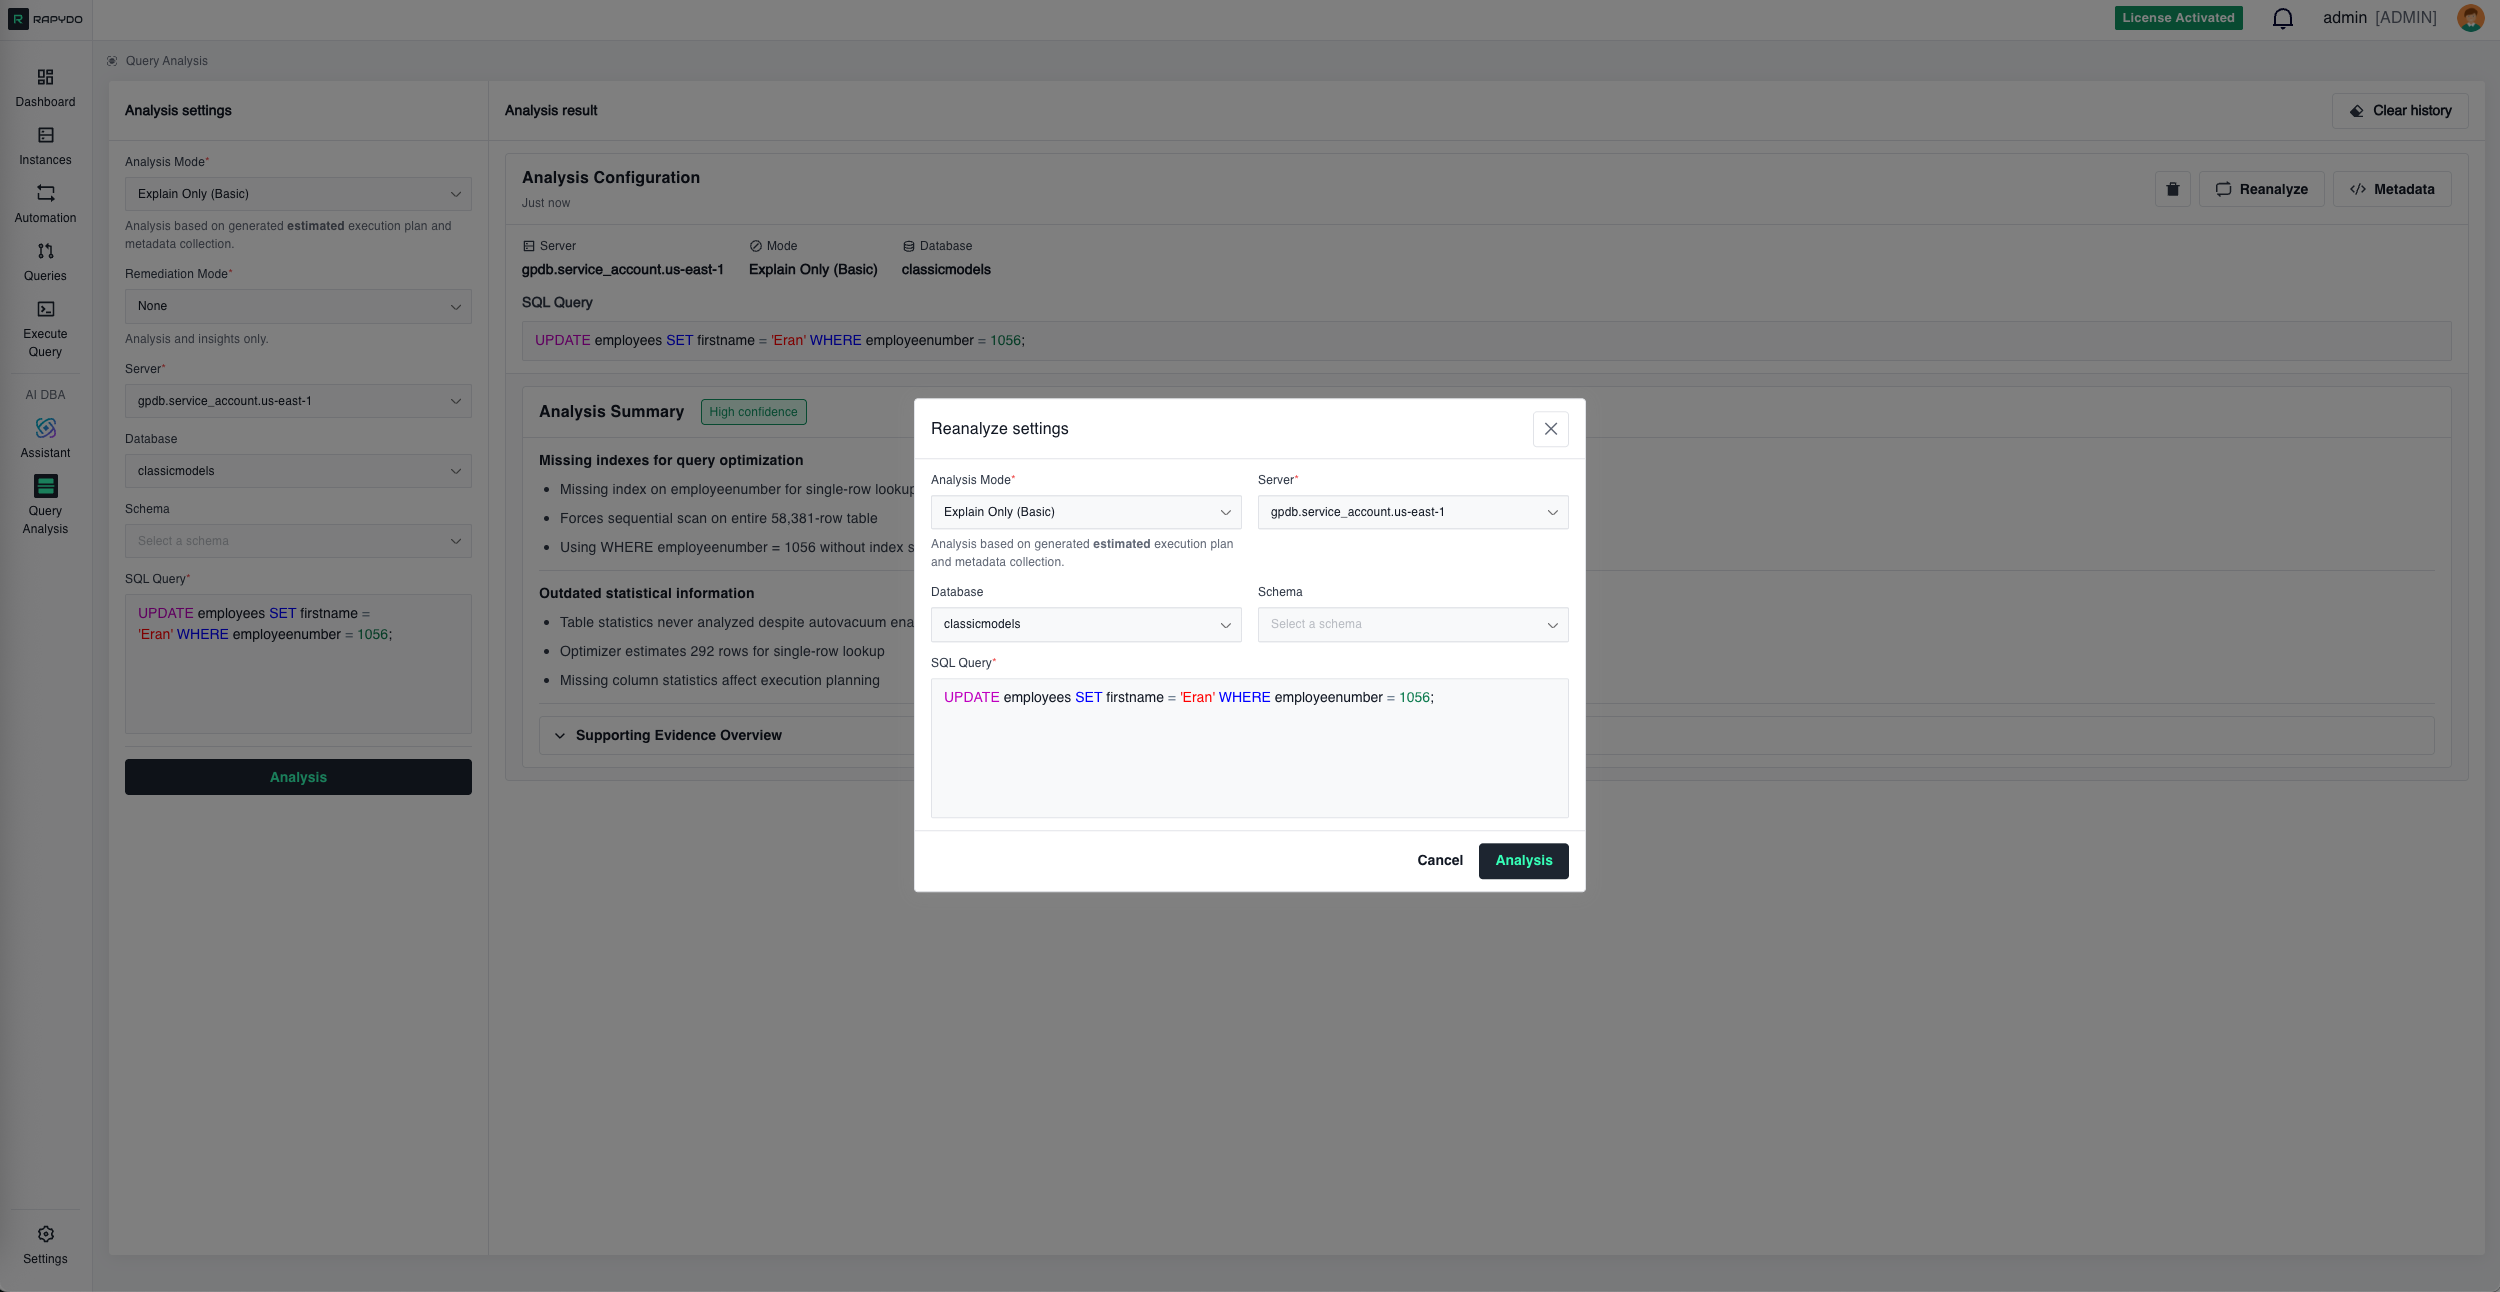 After making changes to your database (like adding an index or updating statistics), click **Reanalyze** to open the **Reanalyze settings** dialog and run a fresh analysis to verify the improvement.
**What Reanalyze checks:**
* ✅ New execution plan with improved costs
* ✅ Index usage confirmation
* ✅ Actual vs. estimated performance
* ✅ Remaining optimization opportunities
***
## Example Workflow
**Scenario:** Dashboard shows an UPDATE query taking 88 seconds
**Step 1:** Dashboard → Hover over the slow query → Click **Analyze Query**
**Step 2:** Query Analysis opens with everything pre-filled (server, database, SQL)
**Step 3:** Click **Analysis**
**Step 4:** AI identifies:
* Missing index on `employeeNumber` column
* Outdated table statistics
* Sequential scan of 56,019 rows
**Step 5:** Review Remediation Plan:
```sql theme={null}
CREATE INDEX idx_employees_employee_number
ON employees(employeeNumber);
ANALYZE employees;
```
**Step 6:** Review execution plan showing sequential scan and high cost
**Step 7:** Execute the recommended SQL in your database
**Step 8:** Click **Reanalyze** to confirm improvement
**Result:** Query now takes \~2 seconds (98% improvement) and uses the new index
***
## Best Practices
### Start with Problematic Queries
Focus on queries identified by:
* AI DBA Assistant ("What's causing high CPU?")
* Dashboard insights (Longest Query widget)
* Query monitoring (Realtime view, Process History)
Rather than analyzing every query, prioritize those causing actual performance issues.
***
### Use the Right Mode for Your Environment
**Production databases:**
* ✅ Use **Explain Only (Basic)** — Safe, no query execution
* ❌ Avoid **Explain Analyze (Advanced)** — Actually runs the query
**Test/staging environments:**
* ✅ Use **Explain Analyze (Advanced)** — Provides actual metrics
* Get real row counts instead of estimates
* Measure actual execution time
***
### Review the Metadata
The execution plan and table statistics often reveal issues the summary might not emphasize:
* Check row estimate accuracy (estimates vs. actual)
* Review filter selectivity
* Examine join algorithms chosen
* Verify statistics last update timestamps
***
### Implement in Order
When multiple issues exist, follow the priority order in the Remediation Plan:
1. **High priority** fixes first (biggest impact)
2. **Medium priority** after verifying high priority worked
3. **Low priority** if needed
***
### Reanalyze After Changes
Always verify that your optimizations had the intended effect:
* ✅ Execution plan changed as expected
* ✅ Cost decreased significantly
* ✅ Index is being used
* ✅ No new issues introduced
***
### Consider the Environment
Before implementing recommendations:
* **Index creation:** May lock tables briefly, plan for low-traffic periods
* **Statistics update:** Safe anytime but consider impact on running queries
* **Query rewrites:** Test thoroughly in staging before production
* **Schema changes:** Coordinate with application deployments
***
## Common Issues Detected
### Missing Indexes
**Symptom:** Sequential scans on large tables, high query cost
**Remediation:** Create indexes on frequently filtered or joined columns
**Expected Impact:** 80-99% reduction in query time for index-eligible queries
***
### Outdated Statistics
**Symptom:** Optimizer choosing wrong join order, inaccurate row estimates
**Remediation:** Run `ANALYZE` on affected tables
**Expected Impact:** Better query plans, 30-70% performance improvement
***
### Inefficient Join Order
**Symptom:** Processing large tables before applying filters
**Remediation:** Rewrite query or update statistics to help optimizer
**Expected Impact:** Fewer intermediate rows, 40-80% improvement
***
### Full Table Scans
**Symptom:** Reading entire table when only few rows needed
**Remediation:** Add WHERE clause filters, create appropriate indexes
**Expected Impact:** Read only necessary rows, 70-95% I/O reduction
***
### N+1 Query Pattern
**Symptom:** Many small queries instead of one join
**Remediation:** Rewrite as single JOIN query
**Expected Impact:** Eliminate round trips, 90%+ improvement
***
## Integration with Other Features
### From AI DBA Assistant
Assistant-identified slow queries link directly to Query Analysis for deep investigation.
### To Execute Query
From Query Analysis, click action buttons to open the Execute Query tool with remediation SQL pre-loaded.
### From Dashboard
Dashboard widgets (Longest Query, Query Avg Time) provide direct access to Query Analysis.
### To Automation
Create Scout Rules based on Query Analysis findings to automatically detect similar issues in the future.
***
## What's Next?
* [AI DBA Assistant](/ai-dba/assistant) - Ask questions about your database fleet in natural language
* [Execute Query](/execute-query/introduction_to_execute_query) - Run SQL queries and remediation commands
* [Queries](/queries/introduction_to_queries) - Monitor real-time query activity
After making changes to your database (like adding an index or updating statistics), click **Reanalyze** to open the **Reanalyze settings** dialog and run a fresh analysis to verify the improvement.
**What Reanalyze checks:**
* ✅ New execution plan with improved costs
* ✅ Index usage confirmation
* ✅ Actual vs. estimated performance
* ✅ Remaining optimization opportunities
***
## Example Workflow
**Scenario:** Dashboard shows an UPDATE query taking 88 seconds
**Step 1:** Dashboard → Hover over the slow query → Click **Analyze Query**
**Step 2:** Query Analysis opens with everything pre-filled (server, database, SQL)
**Step 3:** Click **Analysis**
**Step 4:** AI identifies:
* Missing index on `employeeNumber` column
* Outdated table statistics
* Sequential scan of 56,019 rows
**Step 5:** Review Remediation Plan:
```sql theme={null}
CREATE INDEX idx_employees_employee_number
ON employees(employeeNumber);
ANALYZE employees;
```
**Step 6:** Review execution plan showing sequential scan and high cost
**Step 7:** Execute the recommended SQL in your database
**Step 8:** Click **Reanalyze** to confirm improvement
**Result:** Query now takes \~2 seconds (98% improvement) and uses the new index
***
## Best Practices
### Start with Problematic Queries
Focus on queries identified by:
* AI DBA Assistant ("What's causing high CPU?")
* Dashboard insights (Longest Query widget)
* Query monitoring (Realtime view, Process History)
Rather than analyzing every query, prioritize those causing actual performance issues.
***
### Use the Right Mode for Your Environment
**Production databases:**
* ✅ Use **Explain Only (Basic)** — Safe, no query execution
* ❌ Avoid **Explain Analyze (Advanced)** — Actually runs the query
**Test/staging environments:**
* ✅ Use **Explain Analyze (Advanced)** — Provides actual metrics
* Get real row counts instead of estimates
* Measure actual execution time
***
### Review the Metadata
The execution plan and table statistics often reveal issues the summary might not emphasize:
* Check row estimate accuracy (estimates vs. actual)
* Review filter selectivity
* Examine join algorithms chosen
* Verify statistics last update timestamps
***
### Implement in Order
When multiple issues exist, follow the priority order in the Remediation Plan:
1. **High priority** fixes first (biggest impact)
2. **Medium priority** after verifying high priority worked
3. **Low priority** if needed
***
### Reanalyze After Changes
Always verify that your optimizations had the intended effect:
* ✅ Execution plan changed as expected
* ✅ Cost decreased significantly
* ✅ Index is being used
* ✅ No new issues introduced
***
### Consider the Environment
Before implementing recommendations:
* **Index creation:** May lock tables briefly, plan for low-traffic periods
* **Statistics update:** Safe anytime but consider impact on running queries
* **Query rewrites:** Test thoroughly in staging before production
* **Schema changes:** Coordinate with application deployments
***
## Common Issues Detected
### Missing Indexes
**Symptom:** Sequential scans on large tables, high query cost
**Remediation:** Create indexes on frequently filtered or joined columns
**Expected Impact:** 80-99% reduction in query time for index-eligible queries
***
### Outdated Statistics
**Symptom:** Optimizer choosing wrong join order, inaccurate row estimates
**Remediation:** Run `ANALYZE` on affected tables
**Expected Impact:** Better query plans, 30-70% performance improvement
***
### Inefficient Join Order
**Symptom:** Processing large tables before applying filters
**Remediation:** Rewrite query or update statistics to help optimizer
**Expected Impact:** Fewer intermediate rows, 40-80% improvement
***
### Full Table Scans
**Symptom:** Reading entire table when only few rows needed
**Remediation:** Add WHERE clause filters, create appropriate indexes
**Expected Impact:** Read only necessary rows, 70-95% I/O reduction
***
### N+1 Query Pattern
**Symptom:** Many small queries instead of one join
**Remediation:** Rewrite as single JOIN query
**Expected Impact:** Eliminate round trips, 90%+ improvement
***
## Integration with Other Features
### From AI DBA Assistant
Assistant-identified slow queries link directly to Query Analysis for deep investigation.
### To Execute Query
From Query Analysis, click action buttons to open the Execute Query tool with remediation SQL pre-loaded.
### From Dashboard
Dashboard widgets (Longest Query, Query Avg Time) provide direct access to Query Analysis.
### To Automation
Create Scout Rules based on Query Analysis findings to automatically detect similar issues in the future.
***
## What's Next?
* [AI DBA Assistant](/ai-dba/assistant) - Ask questions about your database fleet in natural language
* [Execute Query](/execute-query/introduction_to_execute_query) - Run SQL queries and remediation commands
* [Queries](/queries/introduction_to_queries) - Monitor real-time query activity